OverView
In "Overview" you can view the statistics of the current project. You can first check Stats to confirm the issue occurrence situation in the project, and then analyze the timeline (Trend Graph) and the issues affecting most amount of devices during the period (Hourly Top Issues, Daily Top Issues), as well as application version, system version, device model (Ranking List) to analyze the problems faced by your project in multiple dimensions.
1 Stats
The stats section is located at the top of the overview, which intuitively reflects the crash, ANR (Android only), and error reporting data of the project on that day. The tabs on the upper right can adjust the displayed data. There are three types of data to choose from:
- Today's device crash rate. (Today's device crash rate = the number of devices with crash today / the total number of devices started today)
- Today's crash count. (This refers to the number of times this type of crash occurred today)
- Today's crash device count. (This refers to the number of devices that experienced this type of crash today)

The stats label also functions as a master switch for the exception overview. By switching the selected exception type, you can control Trend Graph, Hourly Top Issues, Ranking List, Daily Top Issues display content.
2 Trend Graph
The trend graph displays the occurrence of issues in chronological order. You can use the display tag of Stats to switch the issue types displayed in the trend graph.

You can select whether it is a simulator (default simulator + real machine), version (default full version), time (default today), and filter the trend graph data.

You can check "Enable compare" to compare data of a specific version and a specific time period. The comparison function supports hourly compare and daily compare modes.

When browsing data for a single day (for example, selecting "Today" for the time), or turning on hour-level comparison, you can select the statistical dimension of "By Hour" or "Grand Total". Select "By Hour" and each point in the graph represents issue data within an hour. Select "Grand Total". Each point in the graph represents all issue data from 0 o'clock on the day to that time point.

On the right side of the trend graph, you can select the data to be displayed. The calculation method of these data is as follows:
| name | calculation method |
|---|---|
| Device Crash Rate | Crashed Devices/Active Devices |
| Session Crash Rate | Crash Count/App Launched Count |
| Crash Count | The number of times the issue occurred |
| Crashed Devices | The number of devices on which the issue occurred |
| App Launched Count | The number of starts reported |
| Active Devices | The number of devices triggering access |
| Device with ≥3 crashes | The number of devices with ≥3 crashes within the statistical period |

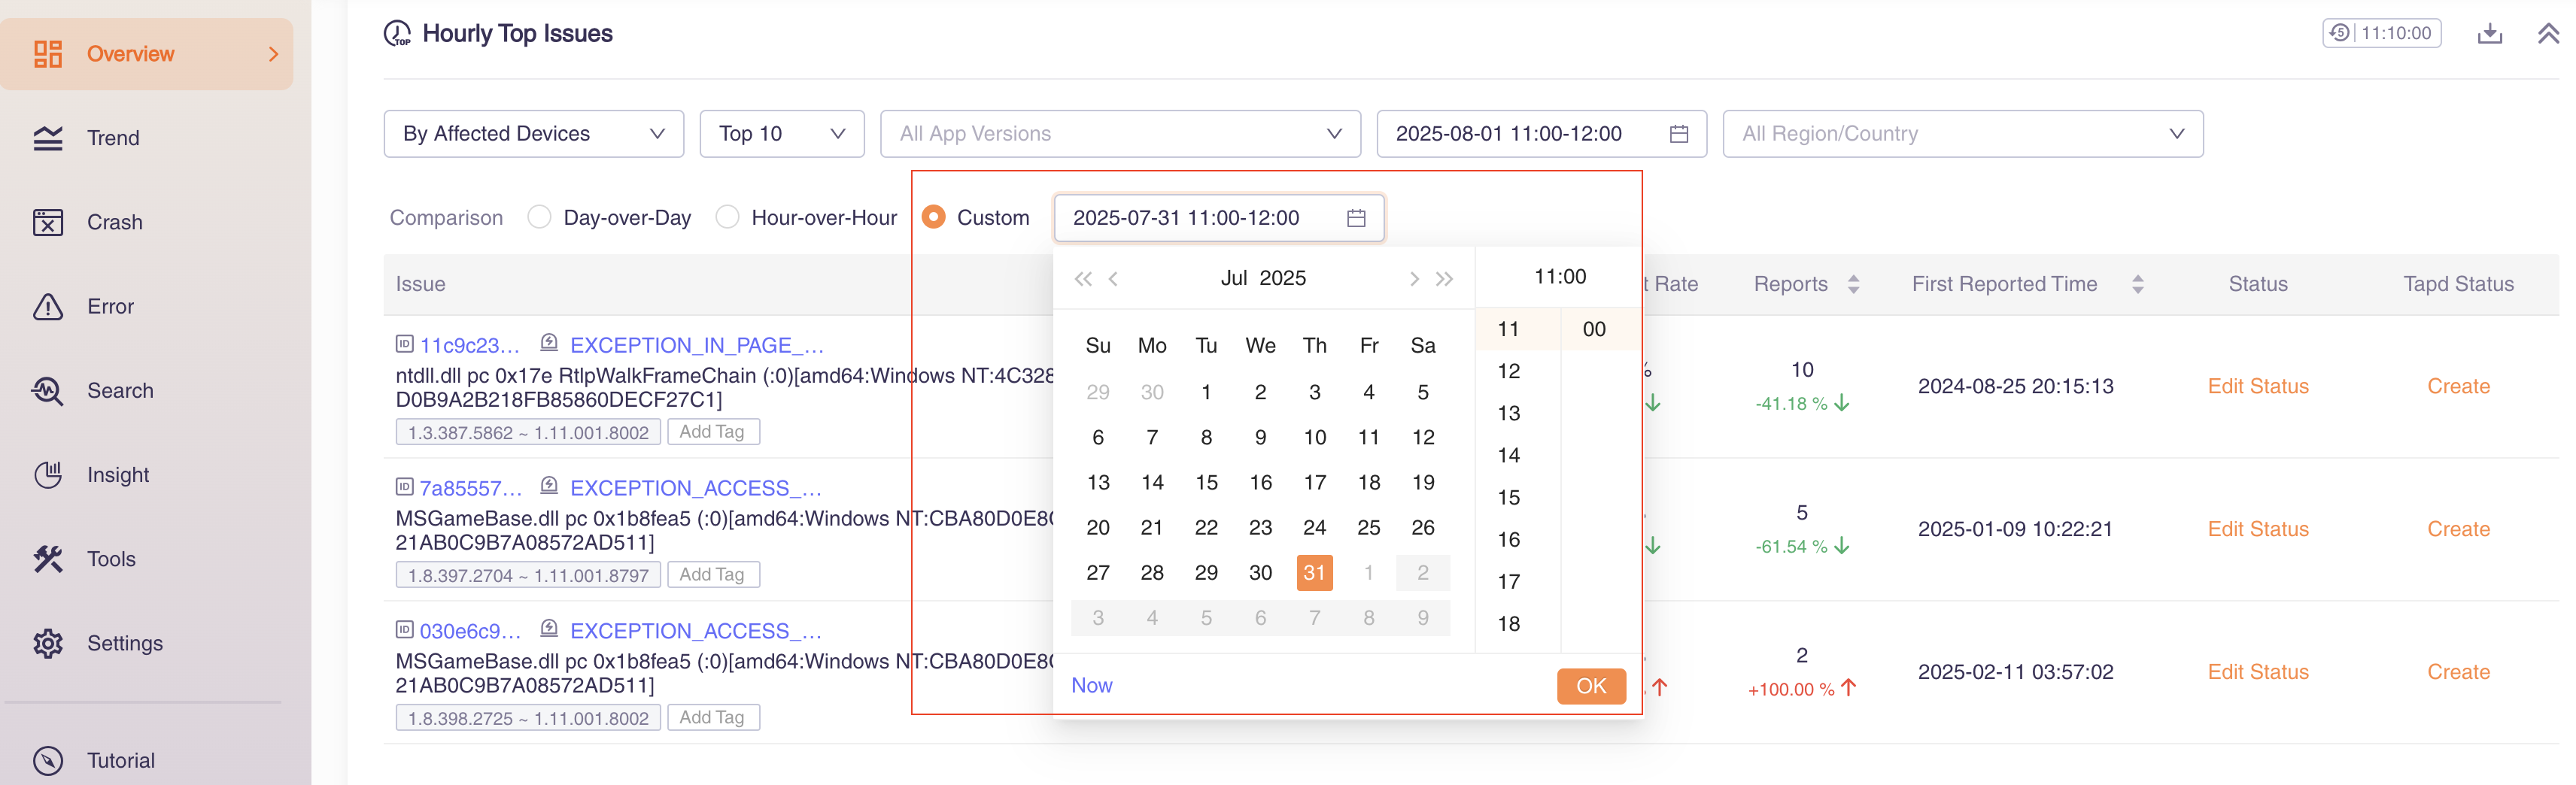
3 Hourly Top Issues
The issues affecting most amount of devices within an hour are displayed here. You can use the display tag of Stats to switch the displayed issue types. The TOP quantity, time range and version can be switched in the tab.

Supports users in comparing crash data across different hours or dates, including Hour-over-hour comparison, Day-over-day (same hour) comparison, and custom time periods, enabling quick identification of periodic anomalies.
Open the Hourly Top Issues page, and you can select the following 3 comparison conditions:
Day-over-day: Select this option in the comparison mode, and the system will compare data between the "current hour" and "same hour of the previous day", which is ideal for checking differences in the same time slot across two days.

Hour-over-hour: The system automatically compares data between the "current hour" and "previous hour", making it suitable for quickly analyzing recent real-time fluctuations.

Custom: After selecting this mode,click the date selection box, pick the corresponding hour of any historical date in the calendar, and confirm. You can then view comparison data for the same hour across days/weeks, facilitating long-term crash trend.
4 Ranking List
The ranking list shows the Top 5 in terms of application version, system version and device model over a period of time. You can use the display tag of Stats to switch the displayed issue types. The ranking list supports switching time periods and filtering by version number. Optional ranking dimensions include crashed devices, device crash rate, and active devices.

Click the button next to the title to download the xlsx file corresponding to the ranking list, which contains Top 100 data.

5 Daily Top Issues
The issues affecting most amount of devices in a day are displayed here. You can use the display tag of Stats to switch the displayed issue types. The TOP quantity, time range and version can be switched in the tab. In the column on the far right, you can change the status of the issue.
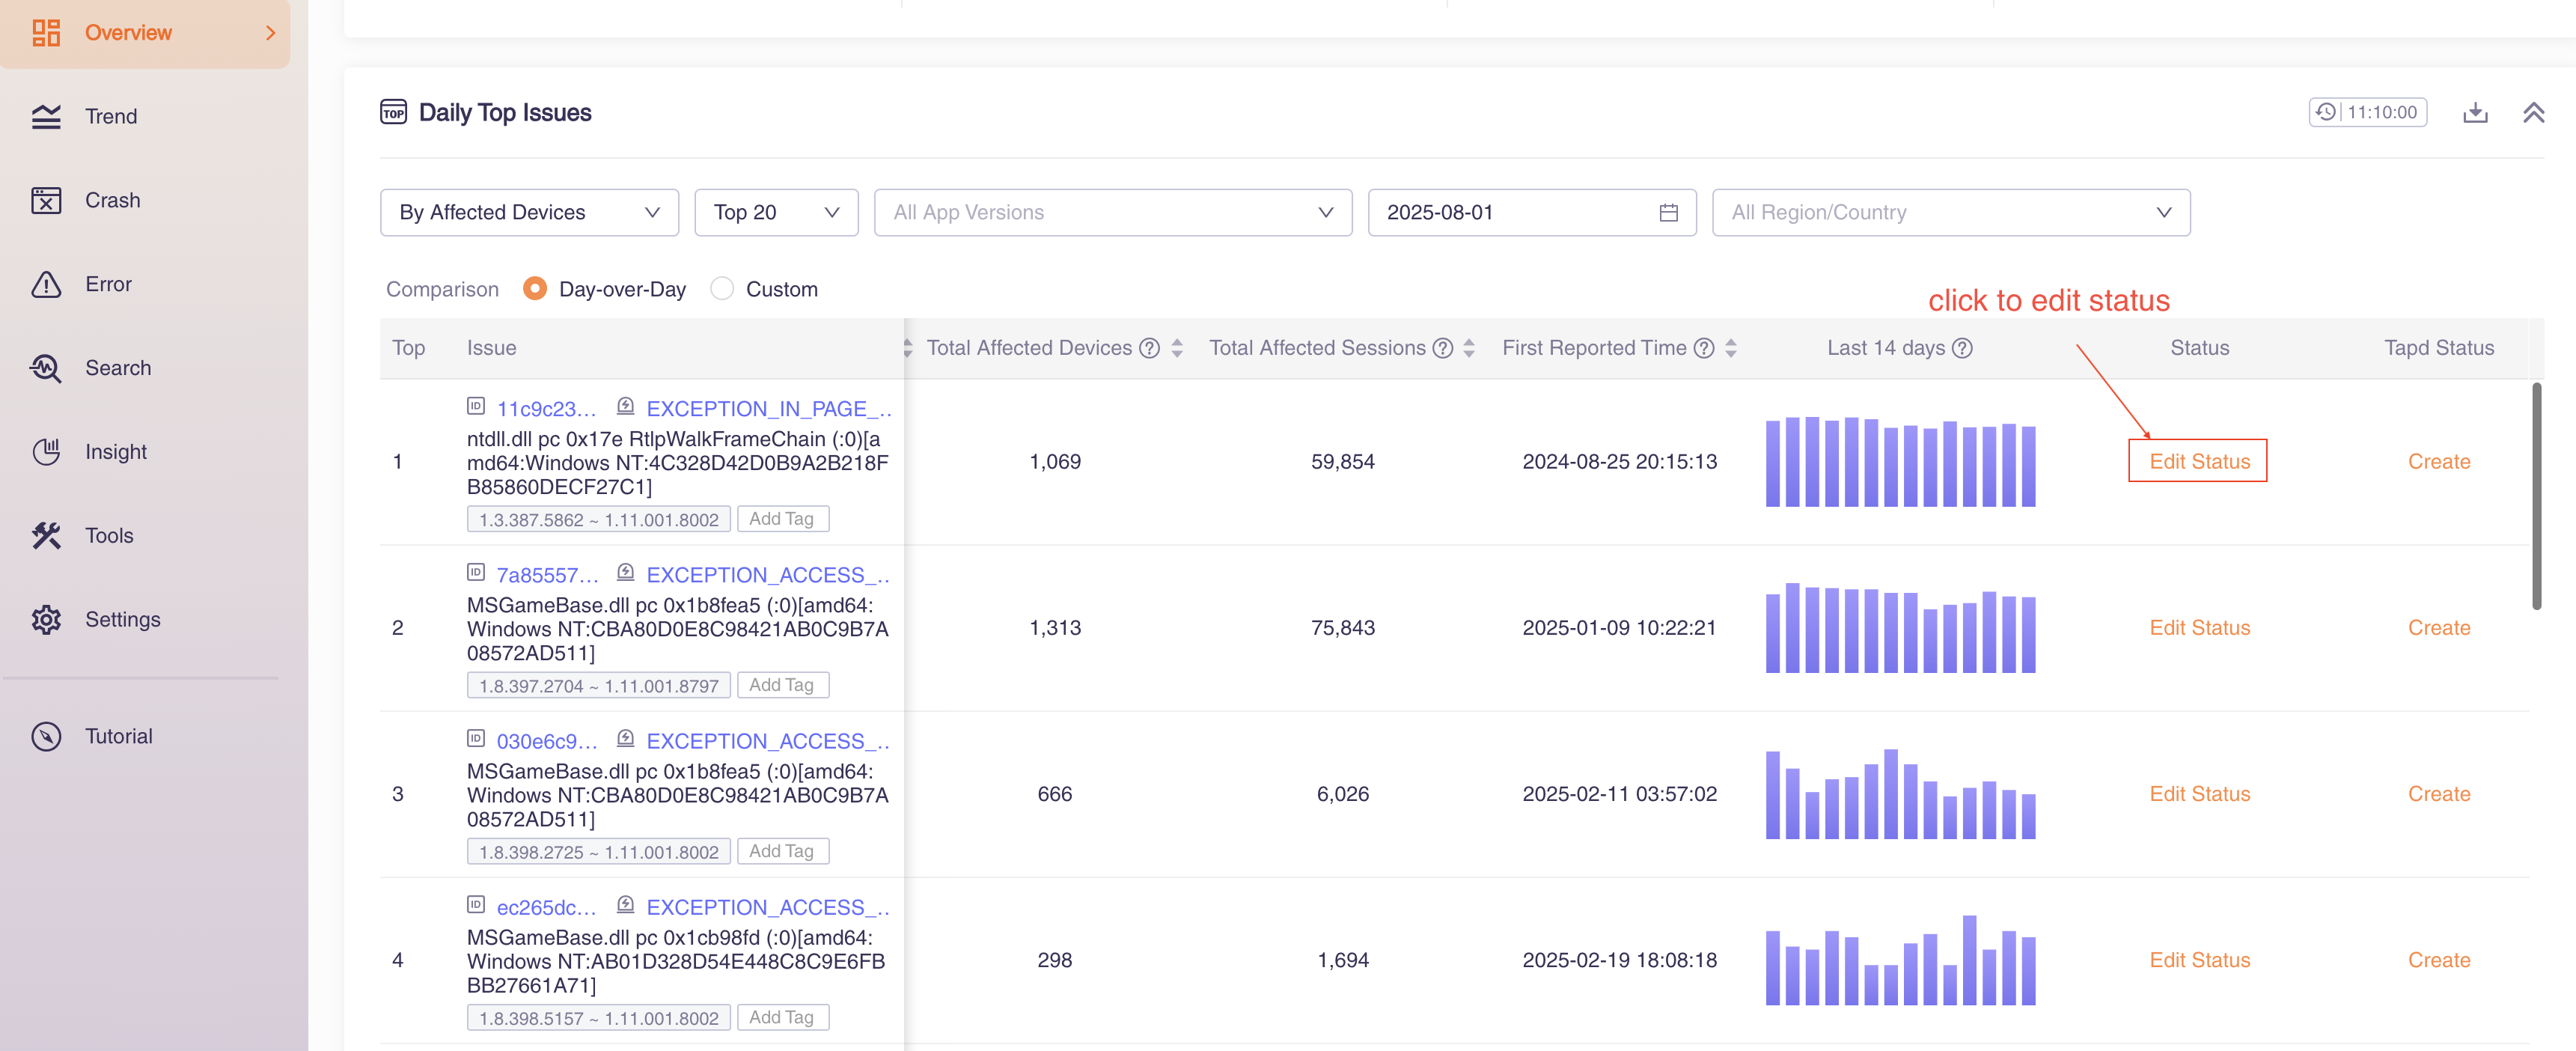
Additionally, there are 2 comparison metrics available on the Daily Top Issues page to help users compare crash data across different time periods:
Day-over-day: Compares the overall data of the current date with the previous day. No extra action is needed, making it ideal for quickly checking issue differences between two consecutive days.

Custom: Click the "Custom" button, manually select any historical date in the pop-up calendar (e.g., today vs last Wednesday, today vs the same day of last month), and click Confirm to view cross-time comparison data, breaking the limitation of only comparing adjacent time periods.

Issues that match the system exit keywords can be filtered. The "Download" button on the right can download the TOP issue data in xlsx format.
