- 1. Client Reports Examples
- 2. Best Practise
- 3. Performance Statistical Data Analysis
- 4. Performance Trend
- 5. Comparison Analysis
- 6. Network Latency
- 7. Key-value Analysis
PerfSight Web Console Guide
1. Client Reports Examples
Here is a sample Unity code using PerfSight:
Initialization
    // In the Awake function, we initialize Perfsight and enable debugging logs.
    void Awake()
    {
        PerfSightAgent.EnableDebugMode();
        PerfSightAgent.InitContext("app id");
    }
Mark Scene
You can call the MarkLoadlevel and MarkLevelFin interface when entering and exiting the scene.
    void Start()
    {
        PerfSightAgent.MarkLoadlevel("Test");
    }

    void OnDestroy()
    {
        PerfSightAgent.MarkLevelFin();
    }
When the scene loading is completed, calling the MarkLoadlevelCompleted interface.
PerfSightAgent.MarkLoadlevelCompleted();
SetUserId
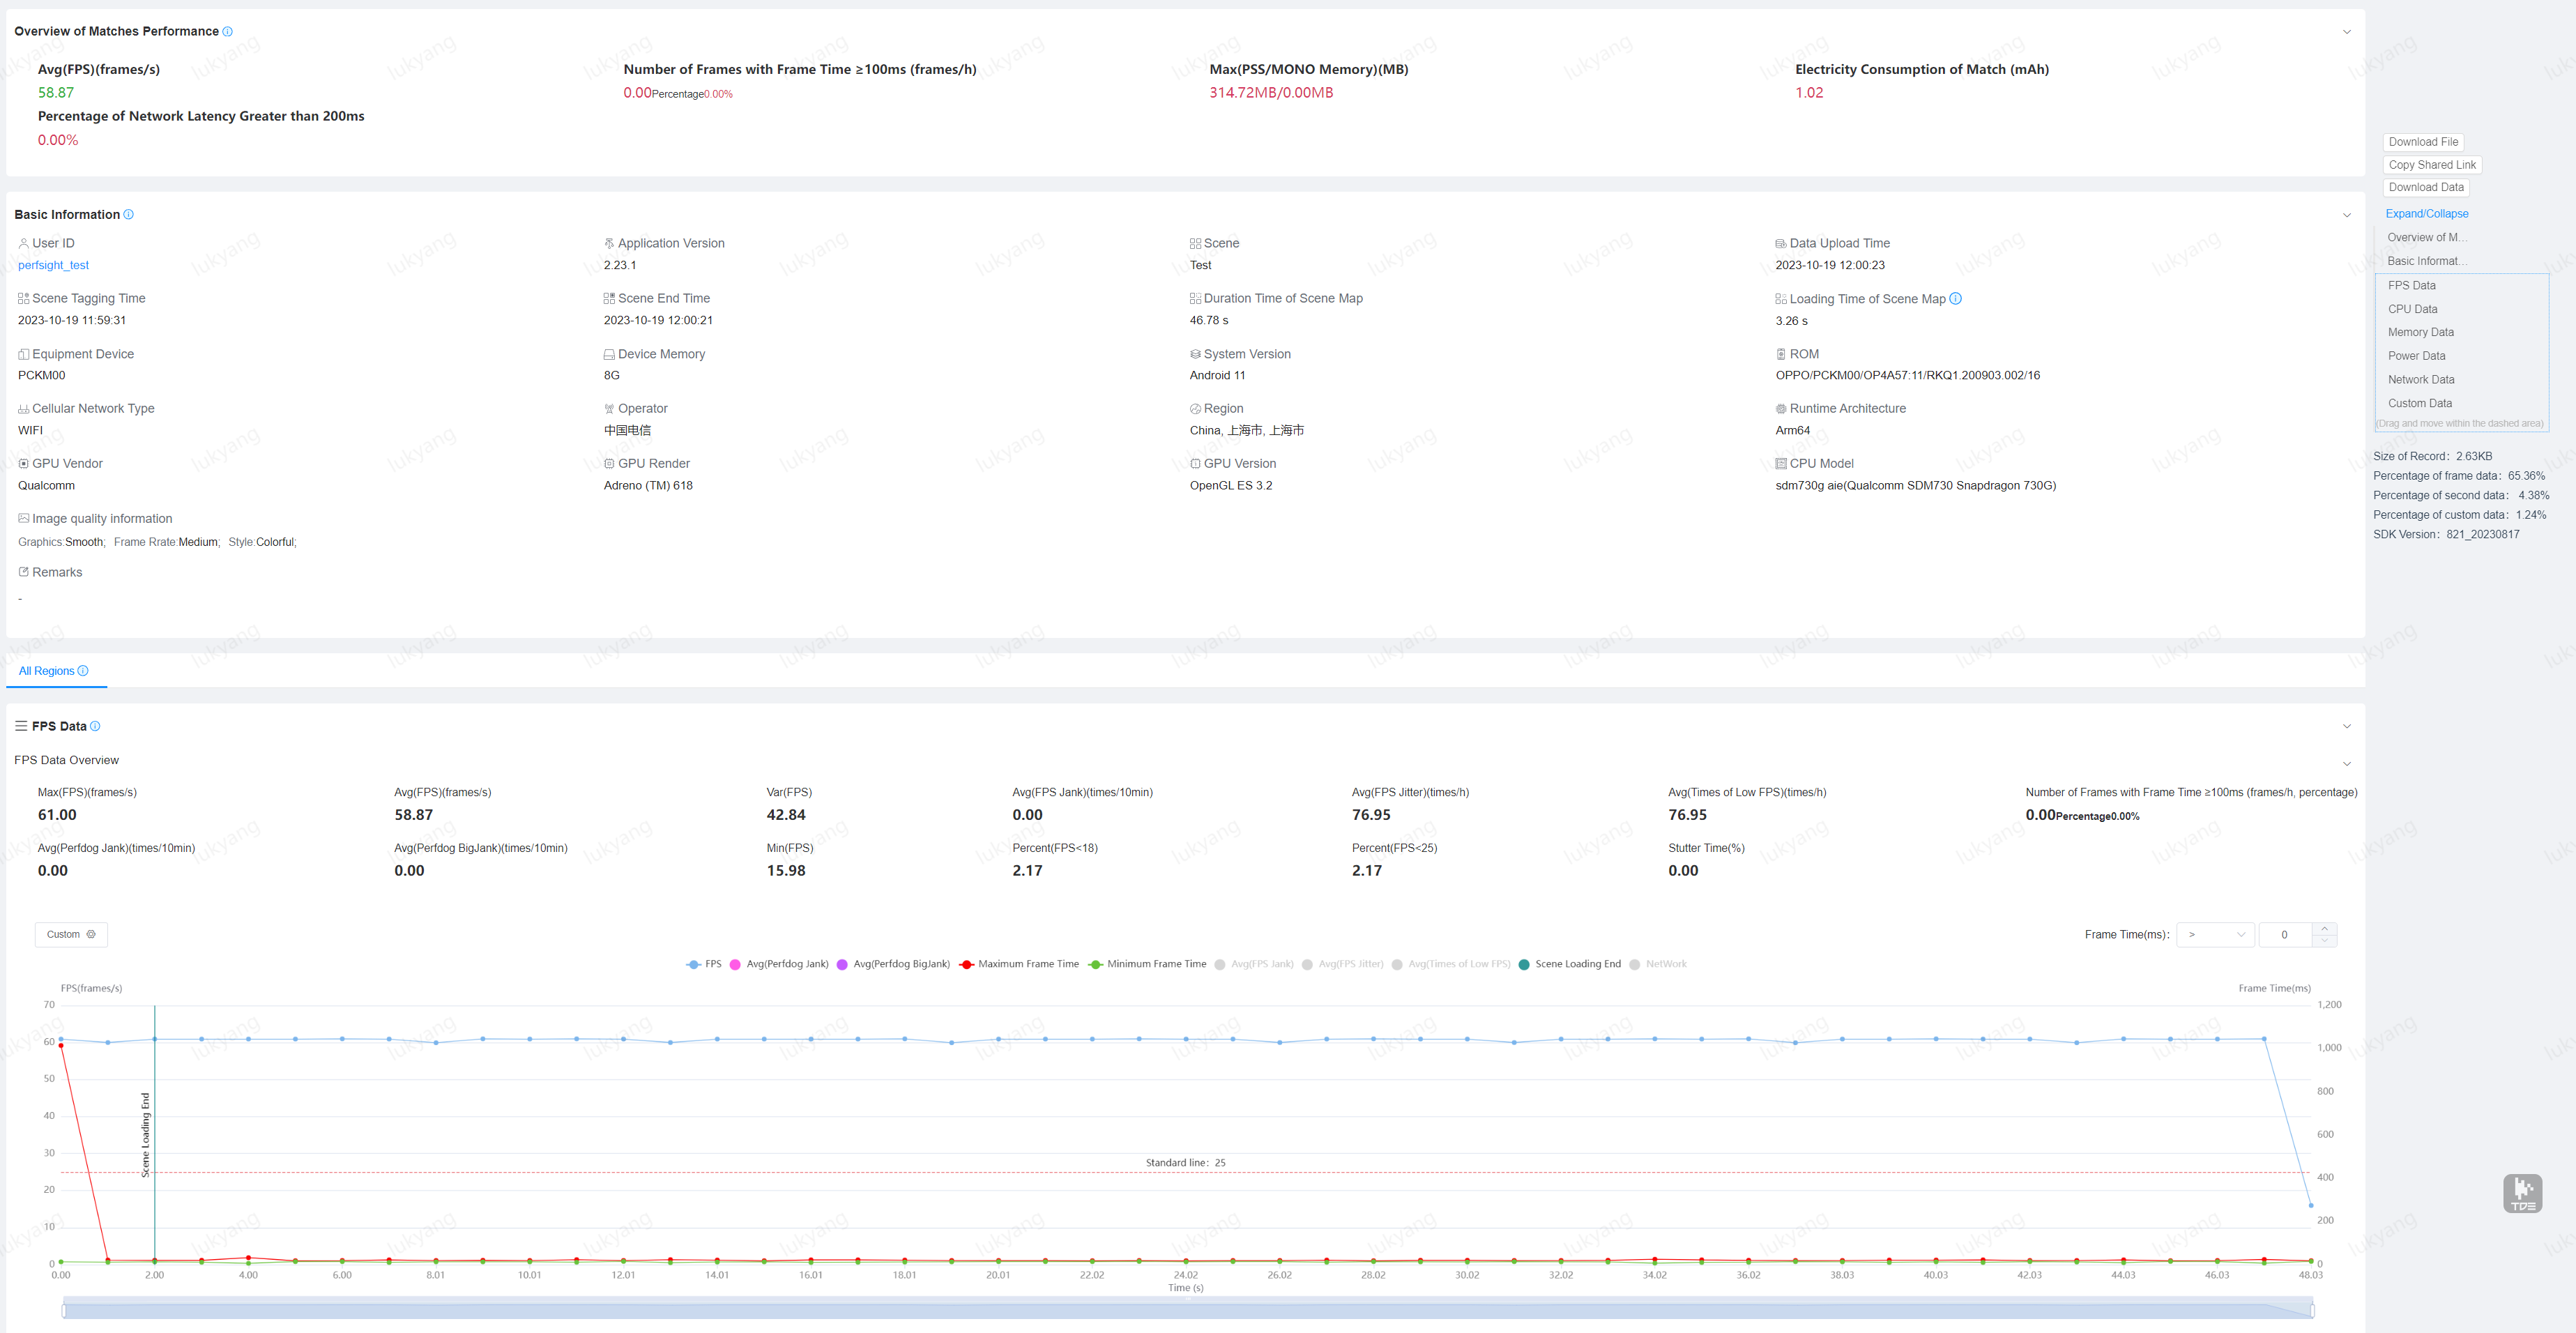
After initializing the Perfsight and obtaining user information, call the SetUserId interface. After setting, we can find the corresponding record in the Equality Search(PlayerID) Page under the Match Details tab.
PerfSightAgent.SetUserId("perfsight_test");

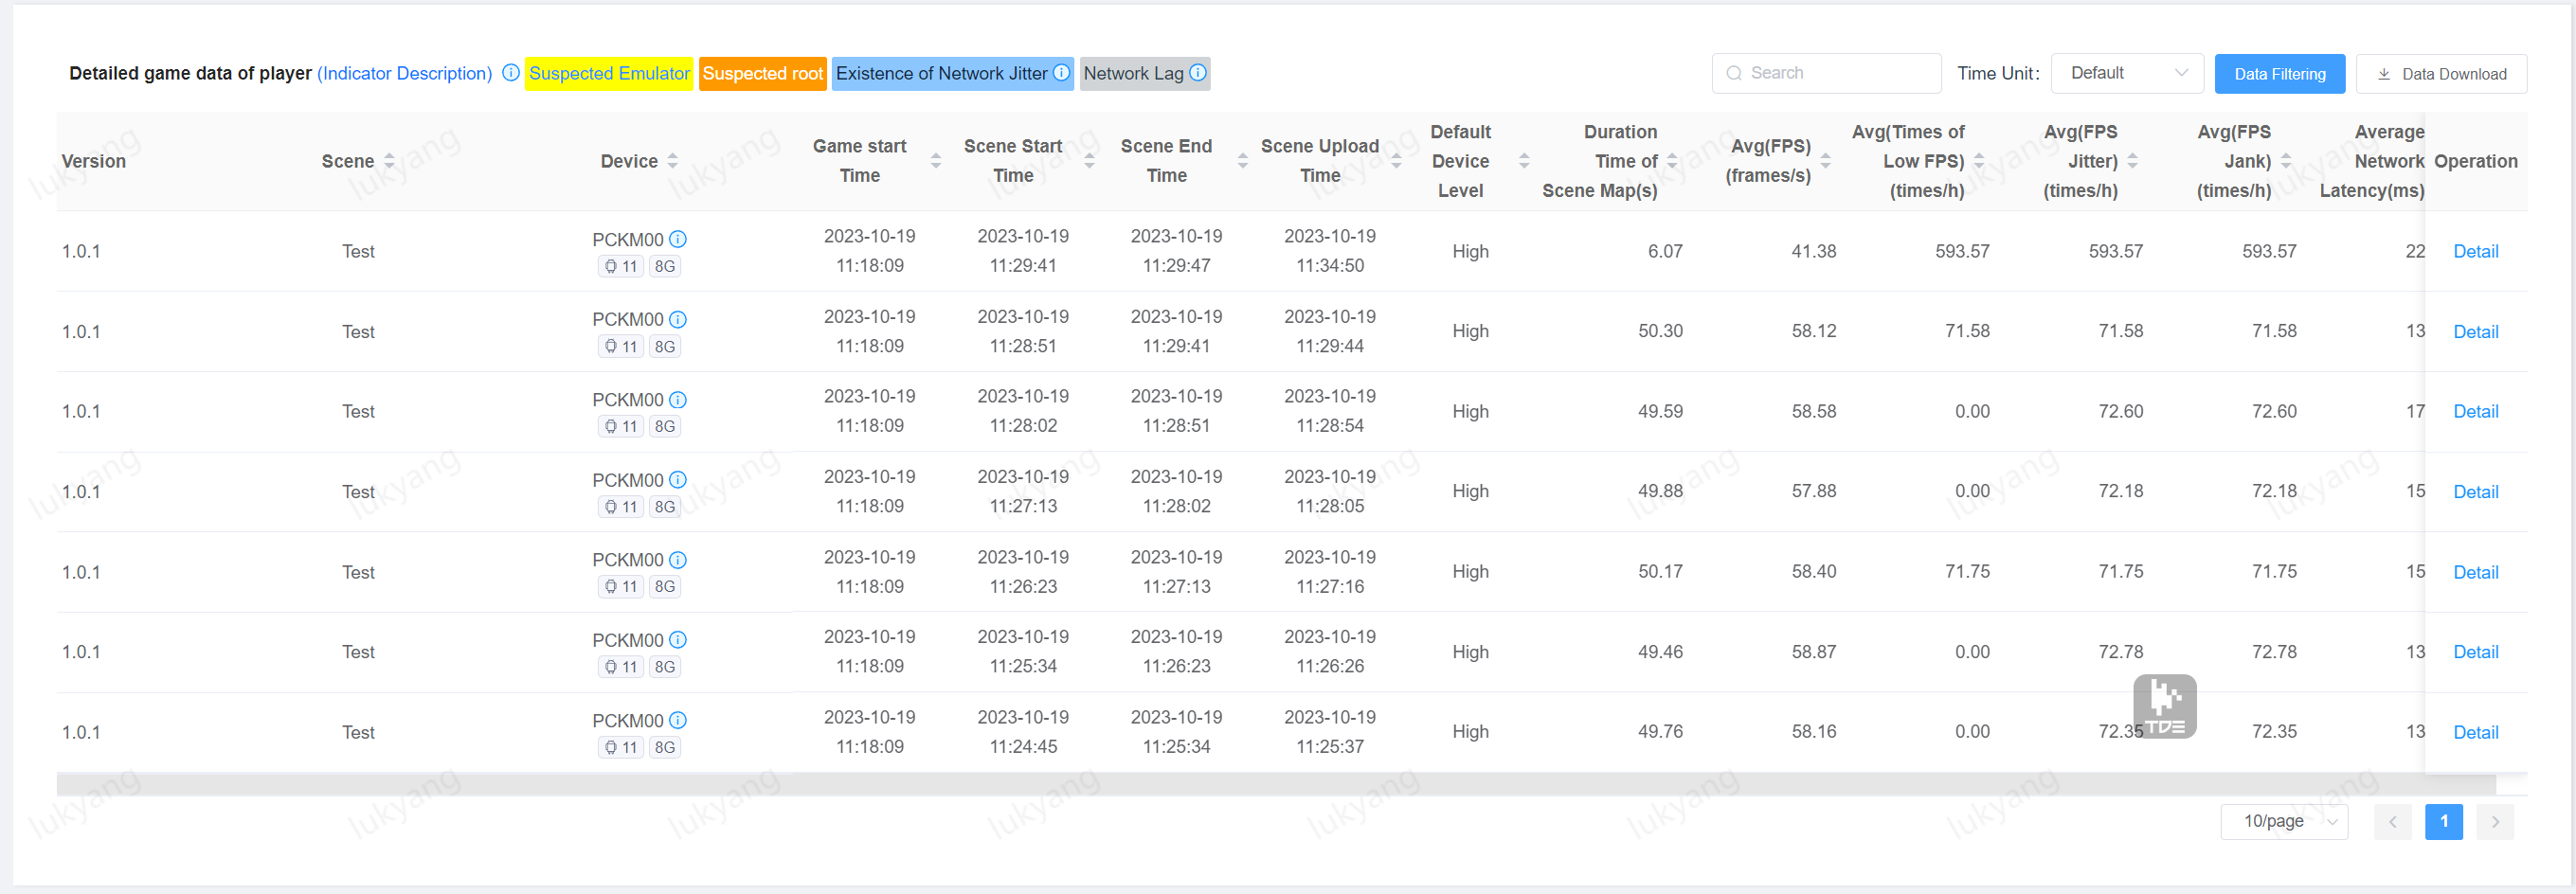
Click the Detail button under the data chart to get detailed performance data.
SetQuality
We configure and report the game quality according to the following rules:
There are three dimensions: Graphics, Frame rate, and Style.
We use an integer number for encoding, with the digits representing the Graphics dimension, the tens representing the Frame rate dimension, and the hundreds representing the Style dimension, resulting in a three-digit integer number.
In the Graphics dimension, we use the numbers 1 to 6 for Smooth, Balanced, HD, HDR, Ultra HD, and Extreme HDR.
In the Frame rate dimension, we use the numbers 1 to 3 for Power Saving, Medium, and High.
In the Style dimension, we use the numbers 1 to 5 for Classic, Colorful, Realistic, Soft, and Movie.
We select the Graphics: Smooth, Frame rate: Medium, and Style: Colorful configurations for reporting.
    Quality value = 1(Smooth,digits representing the Graphics) + 2(Medium)*10(tens representing the Frame rate) + 2(Colorful)*100(hundreds representing the Style) = 221
    PerfSightAgent.SetQuality(221);
After PerfSight is configured according to the above rules, you can use custom game quality to search for games in the Conditional Search Page under the Match Details tab. 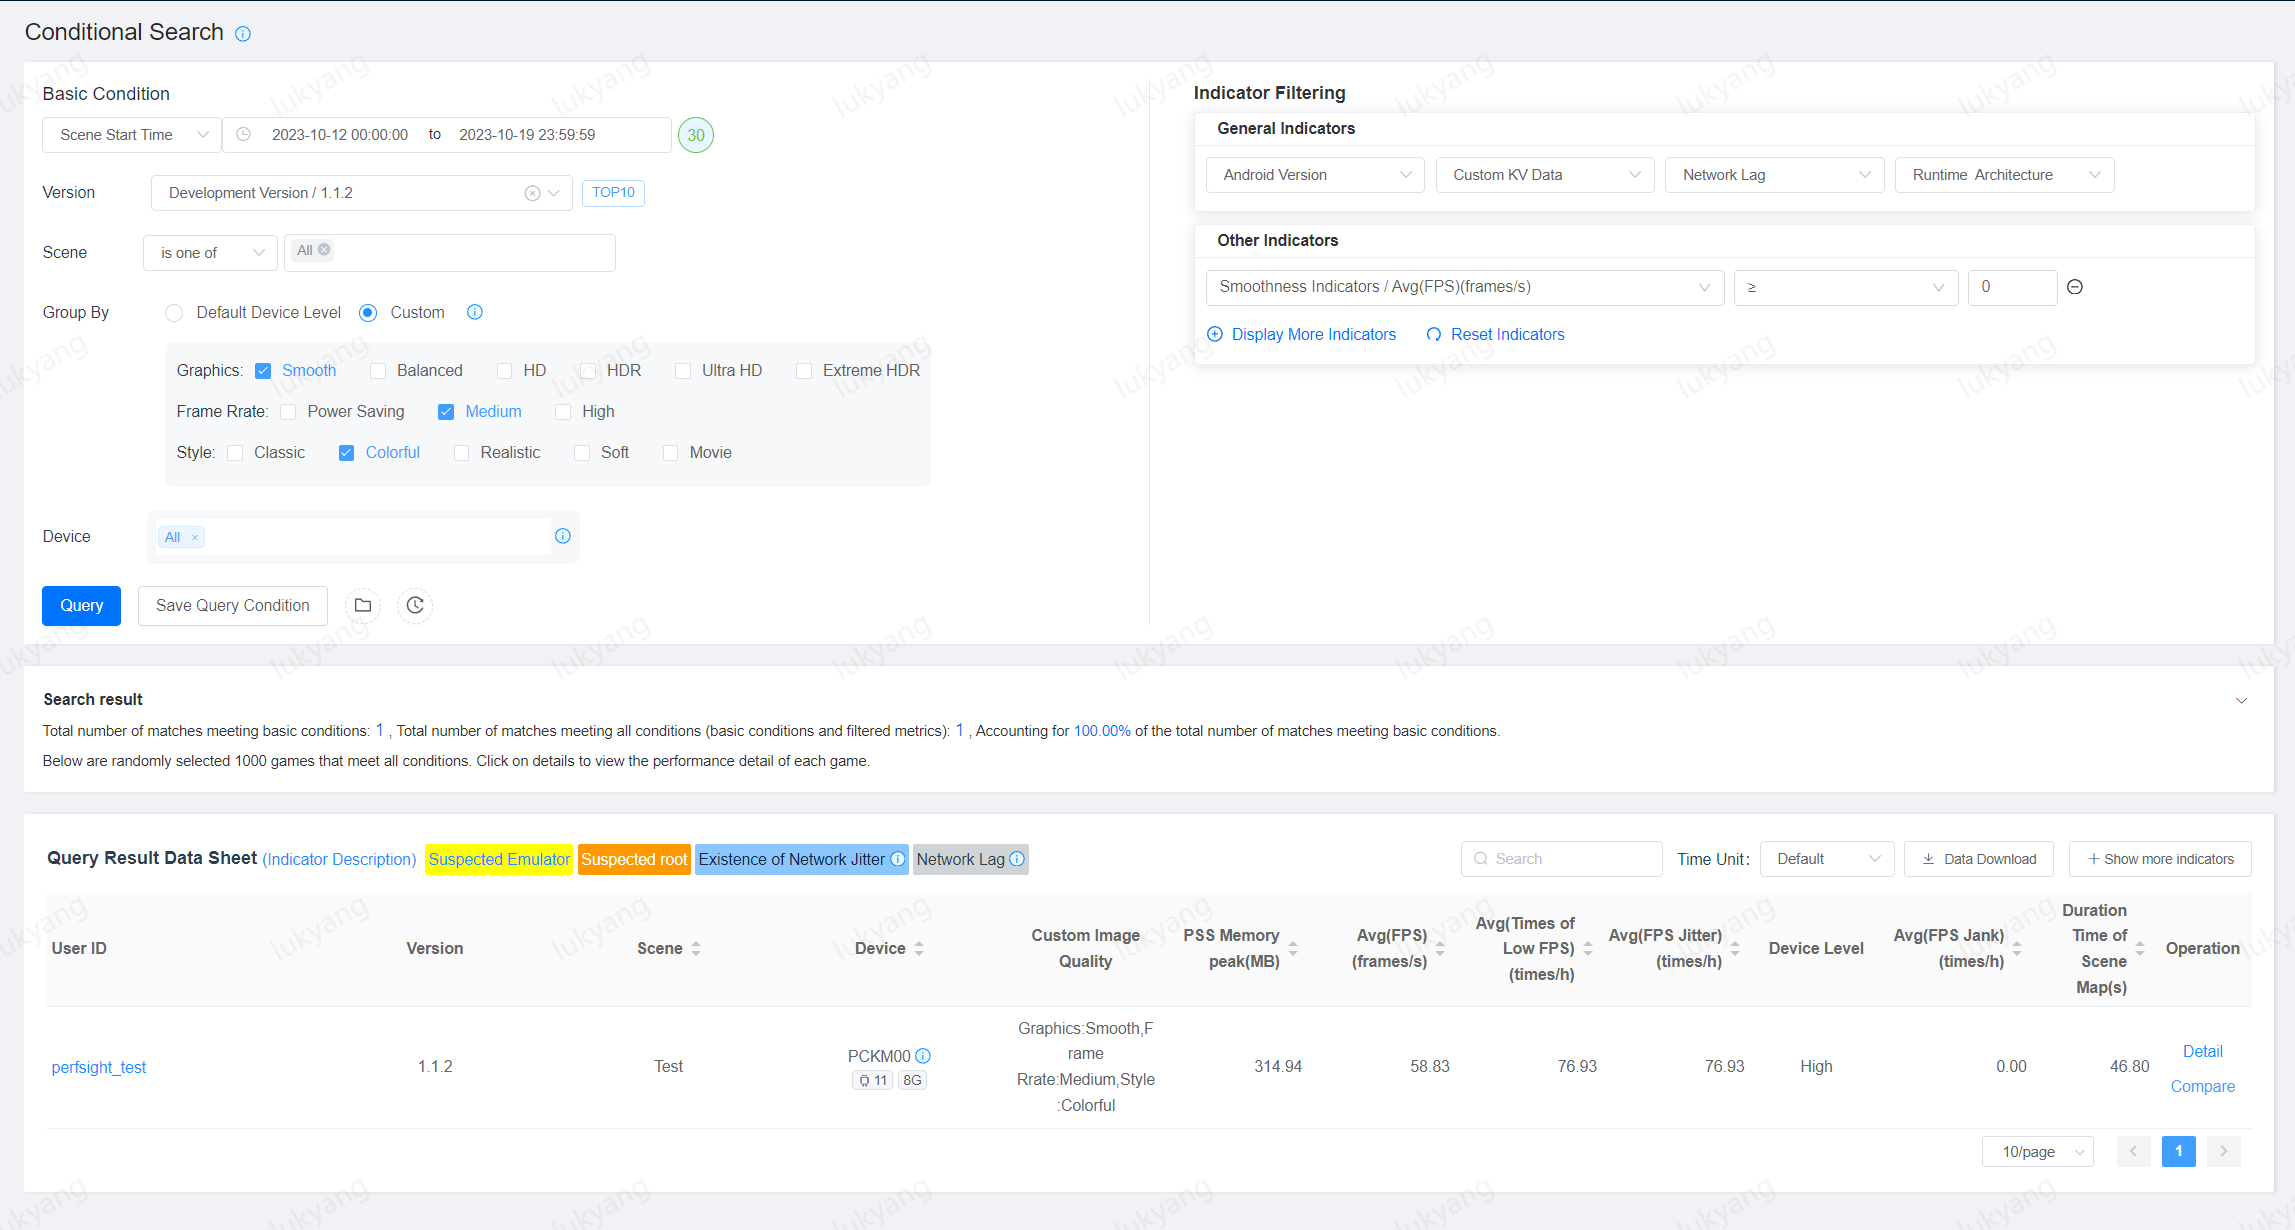
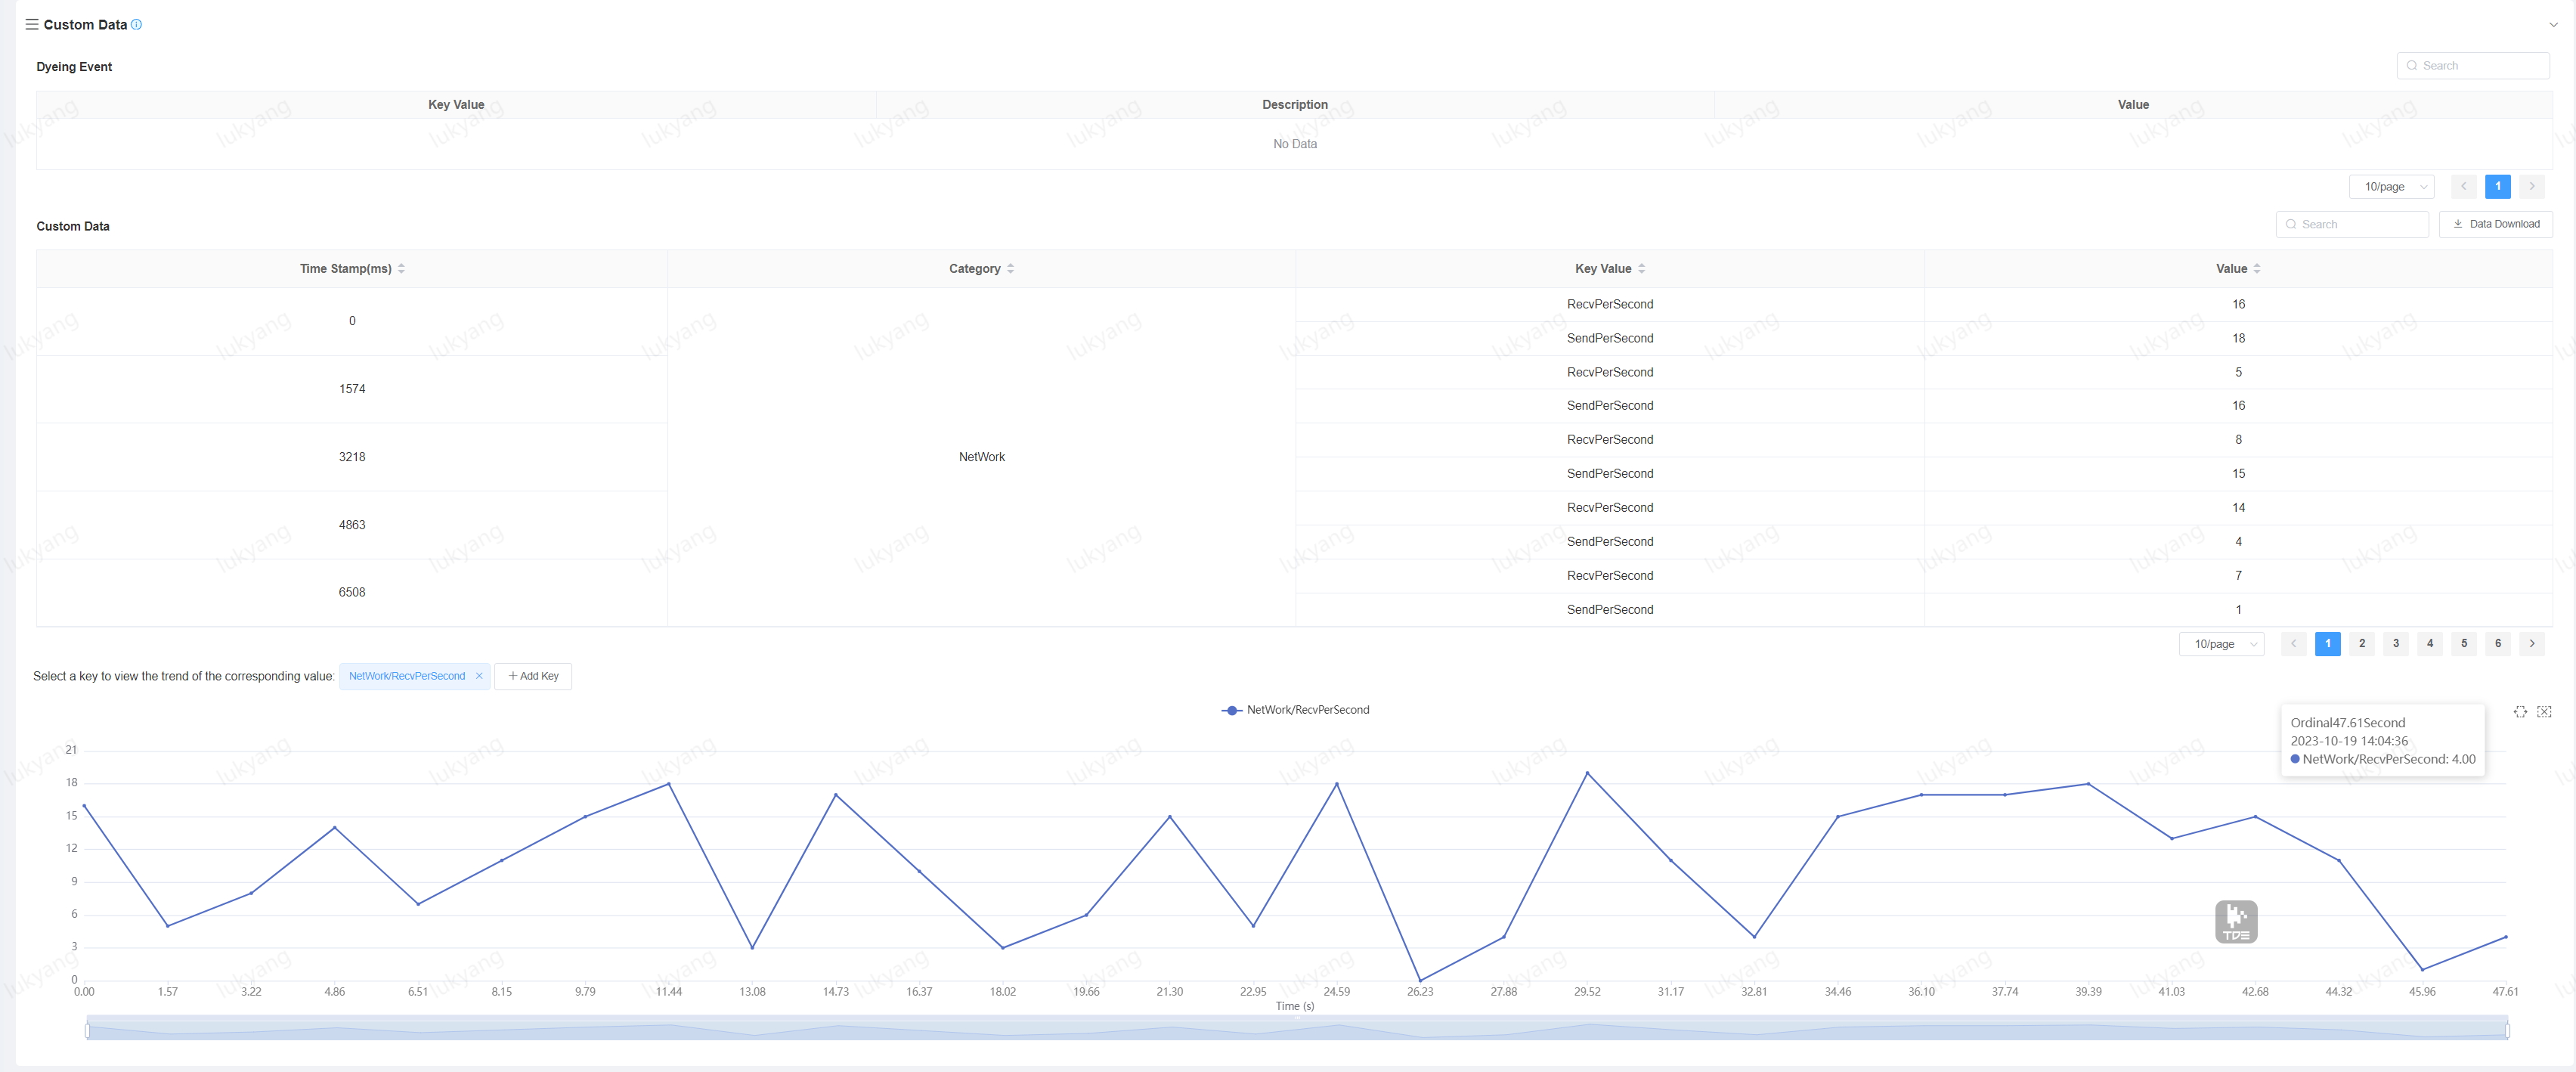
Custom Data
You can use the PostNetworkLatency interface to report network delays and the PostValueX series interface to report custom data. In the following example, the game's packet sending and receiving status is reported through the PostValueX interface.
    PerfSightAgent.PostValueI("NetWork", "RecvPerSecond", recv);
    PerfSightAgent.PostValueI("NetWork", "SendPerSecond", send);
    PerfSightAgent.PostNetworkLatency(latency);
You can see the corresponding data under the network data and custom data of the record details. 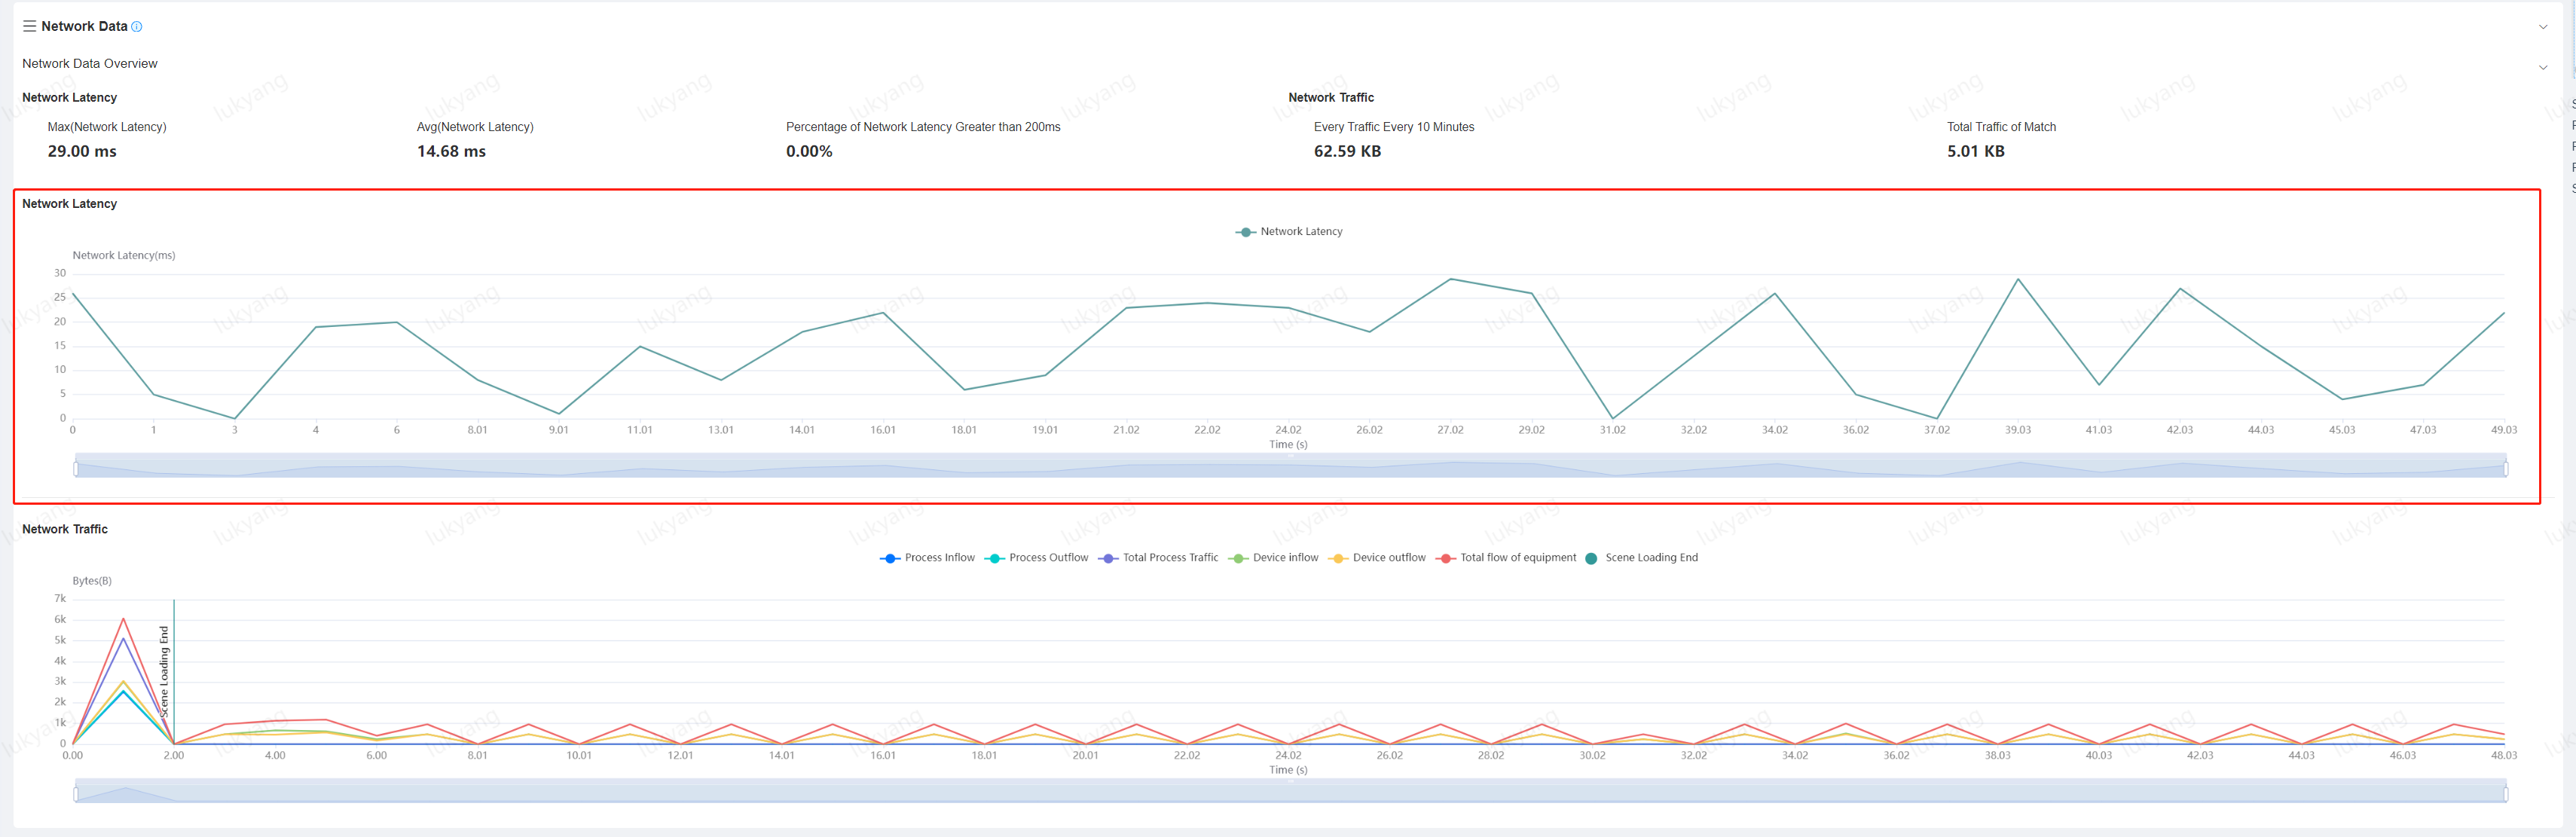
2. Best Practise
Performance Problem Localization
When a user gives us feedback about a performance issue with a specific device or scene, we can use Performance Details and Match Details to analyze the issue. We can start by selecting the appropriate scene via the Performance Trend Page to see if the Smoothness Indicators have fluctuated recently.
When the curve reacts with anomalies, we can further filter out the data with performance problems through Conditional Search Page and clicking on the Detail to further analyze the problem.
How to check the performance of a new released version?
When a new version is released, we can use the Version Comparison Page to compare the performance of the previous release version with the new released version to see if there are any performance issues with the new version.
3. Performance Statistical Data Analysis
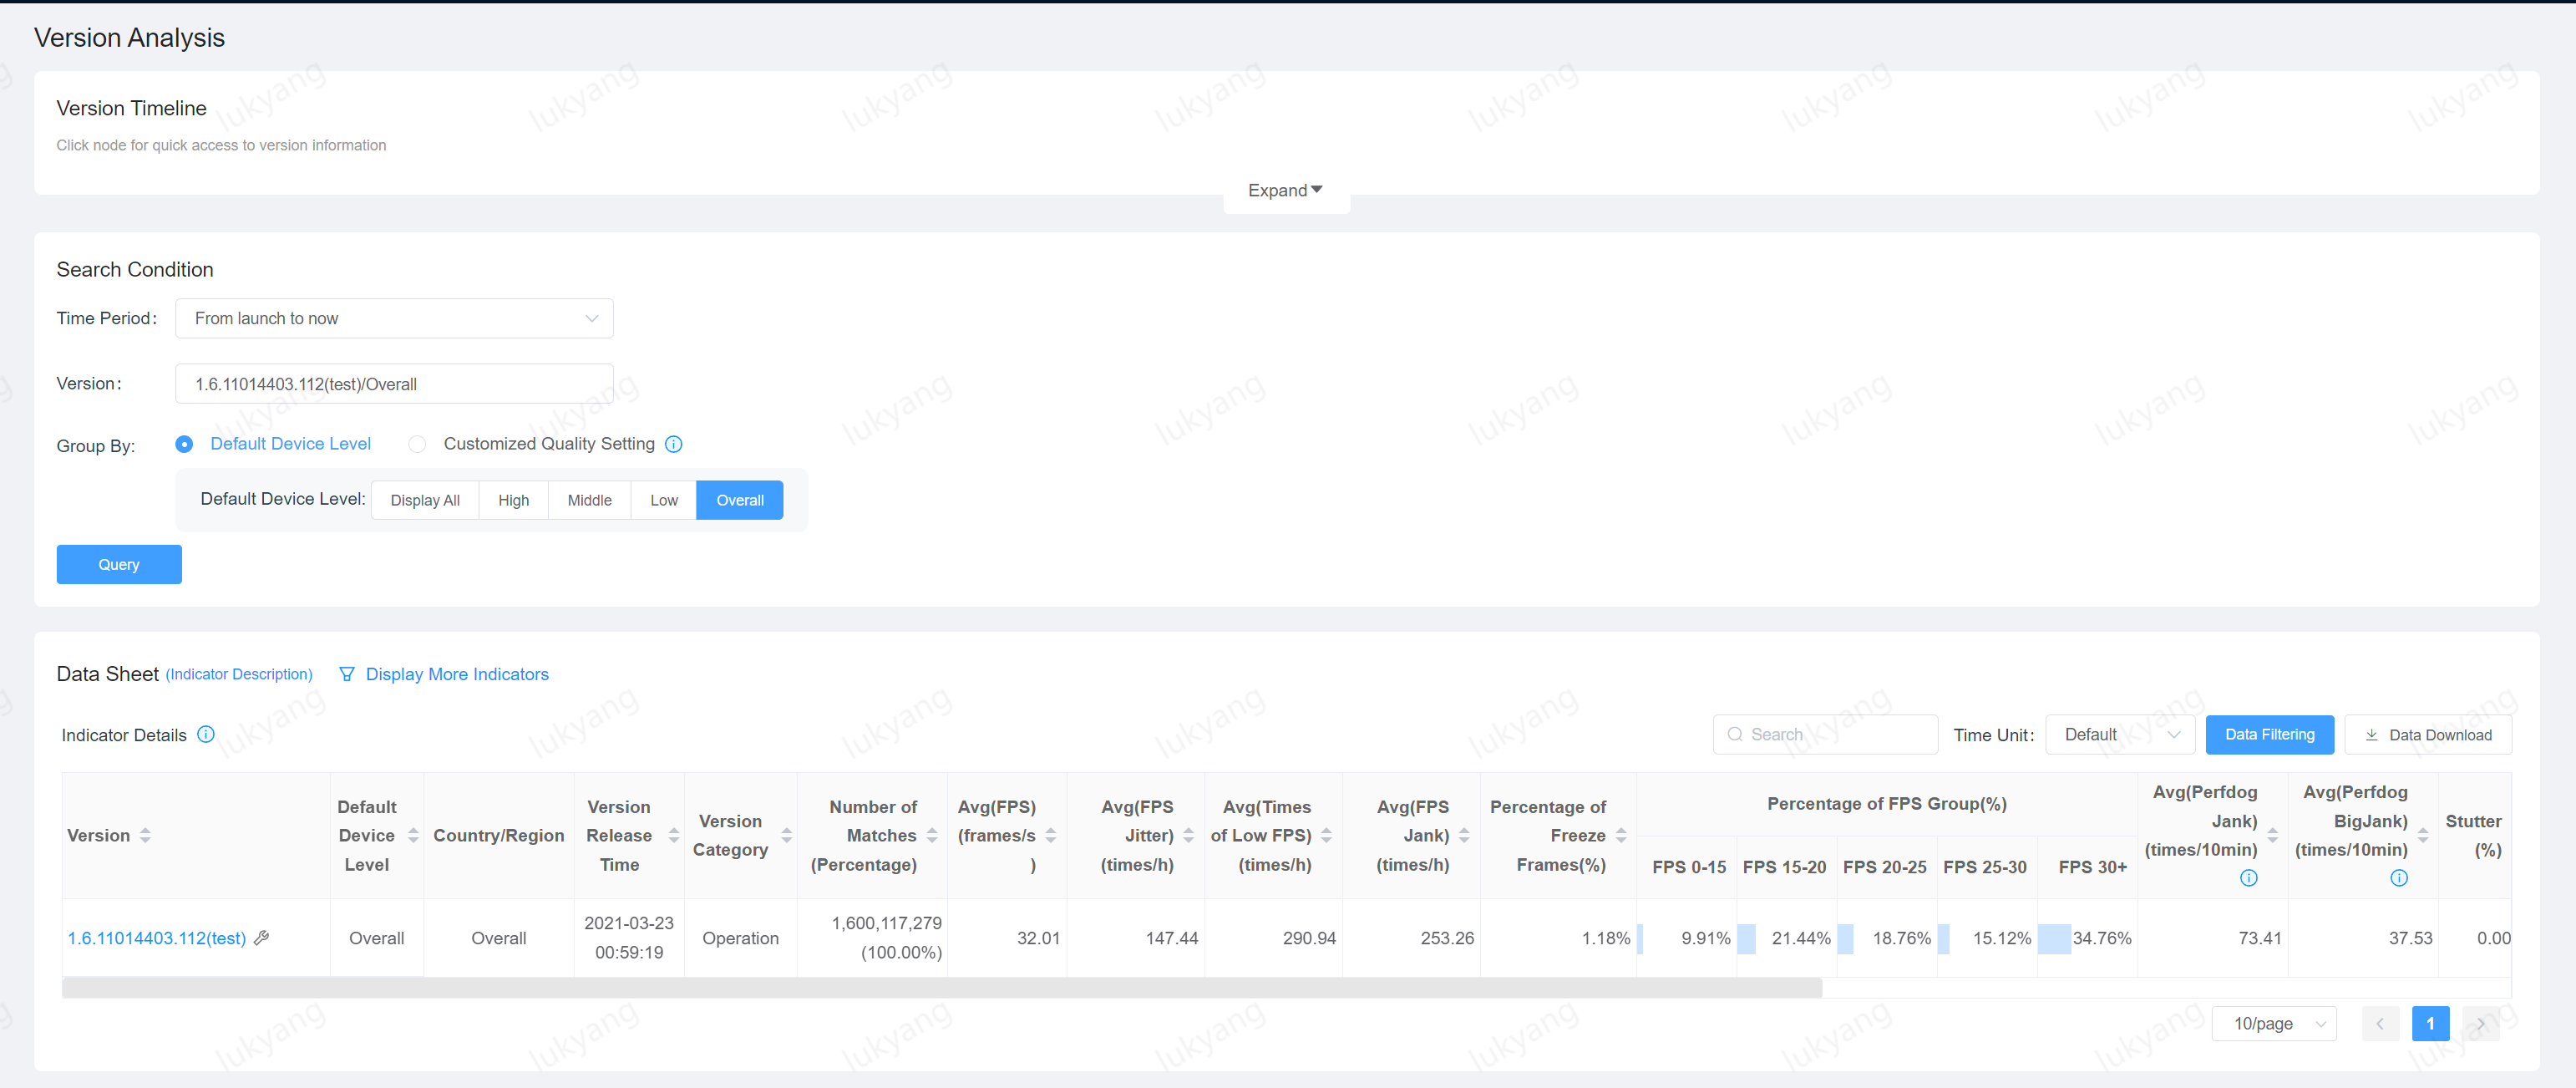
3.1 Version Analysis
Version Analysis Page can query performance data for a specific version. The query supports version cycle or custom time cycle as the unit.
3.2 Scene Analysis
Scene Analysis Page can query the performance data in the version and scene dimensions. The query supports version cycle or custom time cycle as the unit. 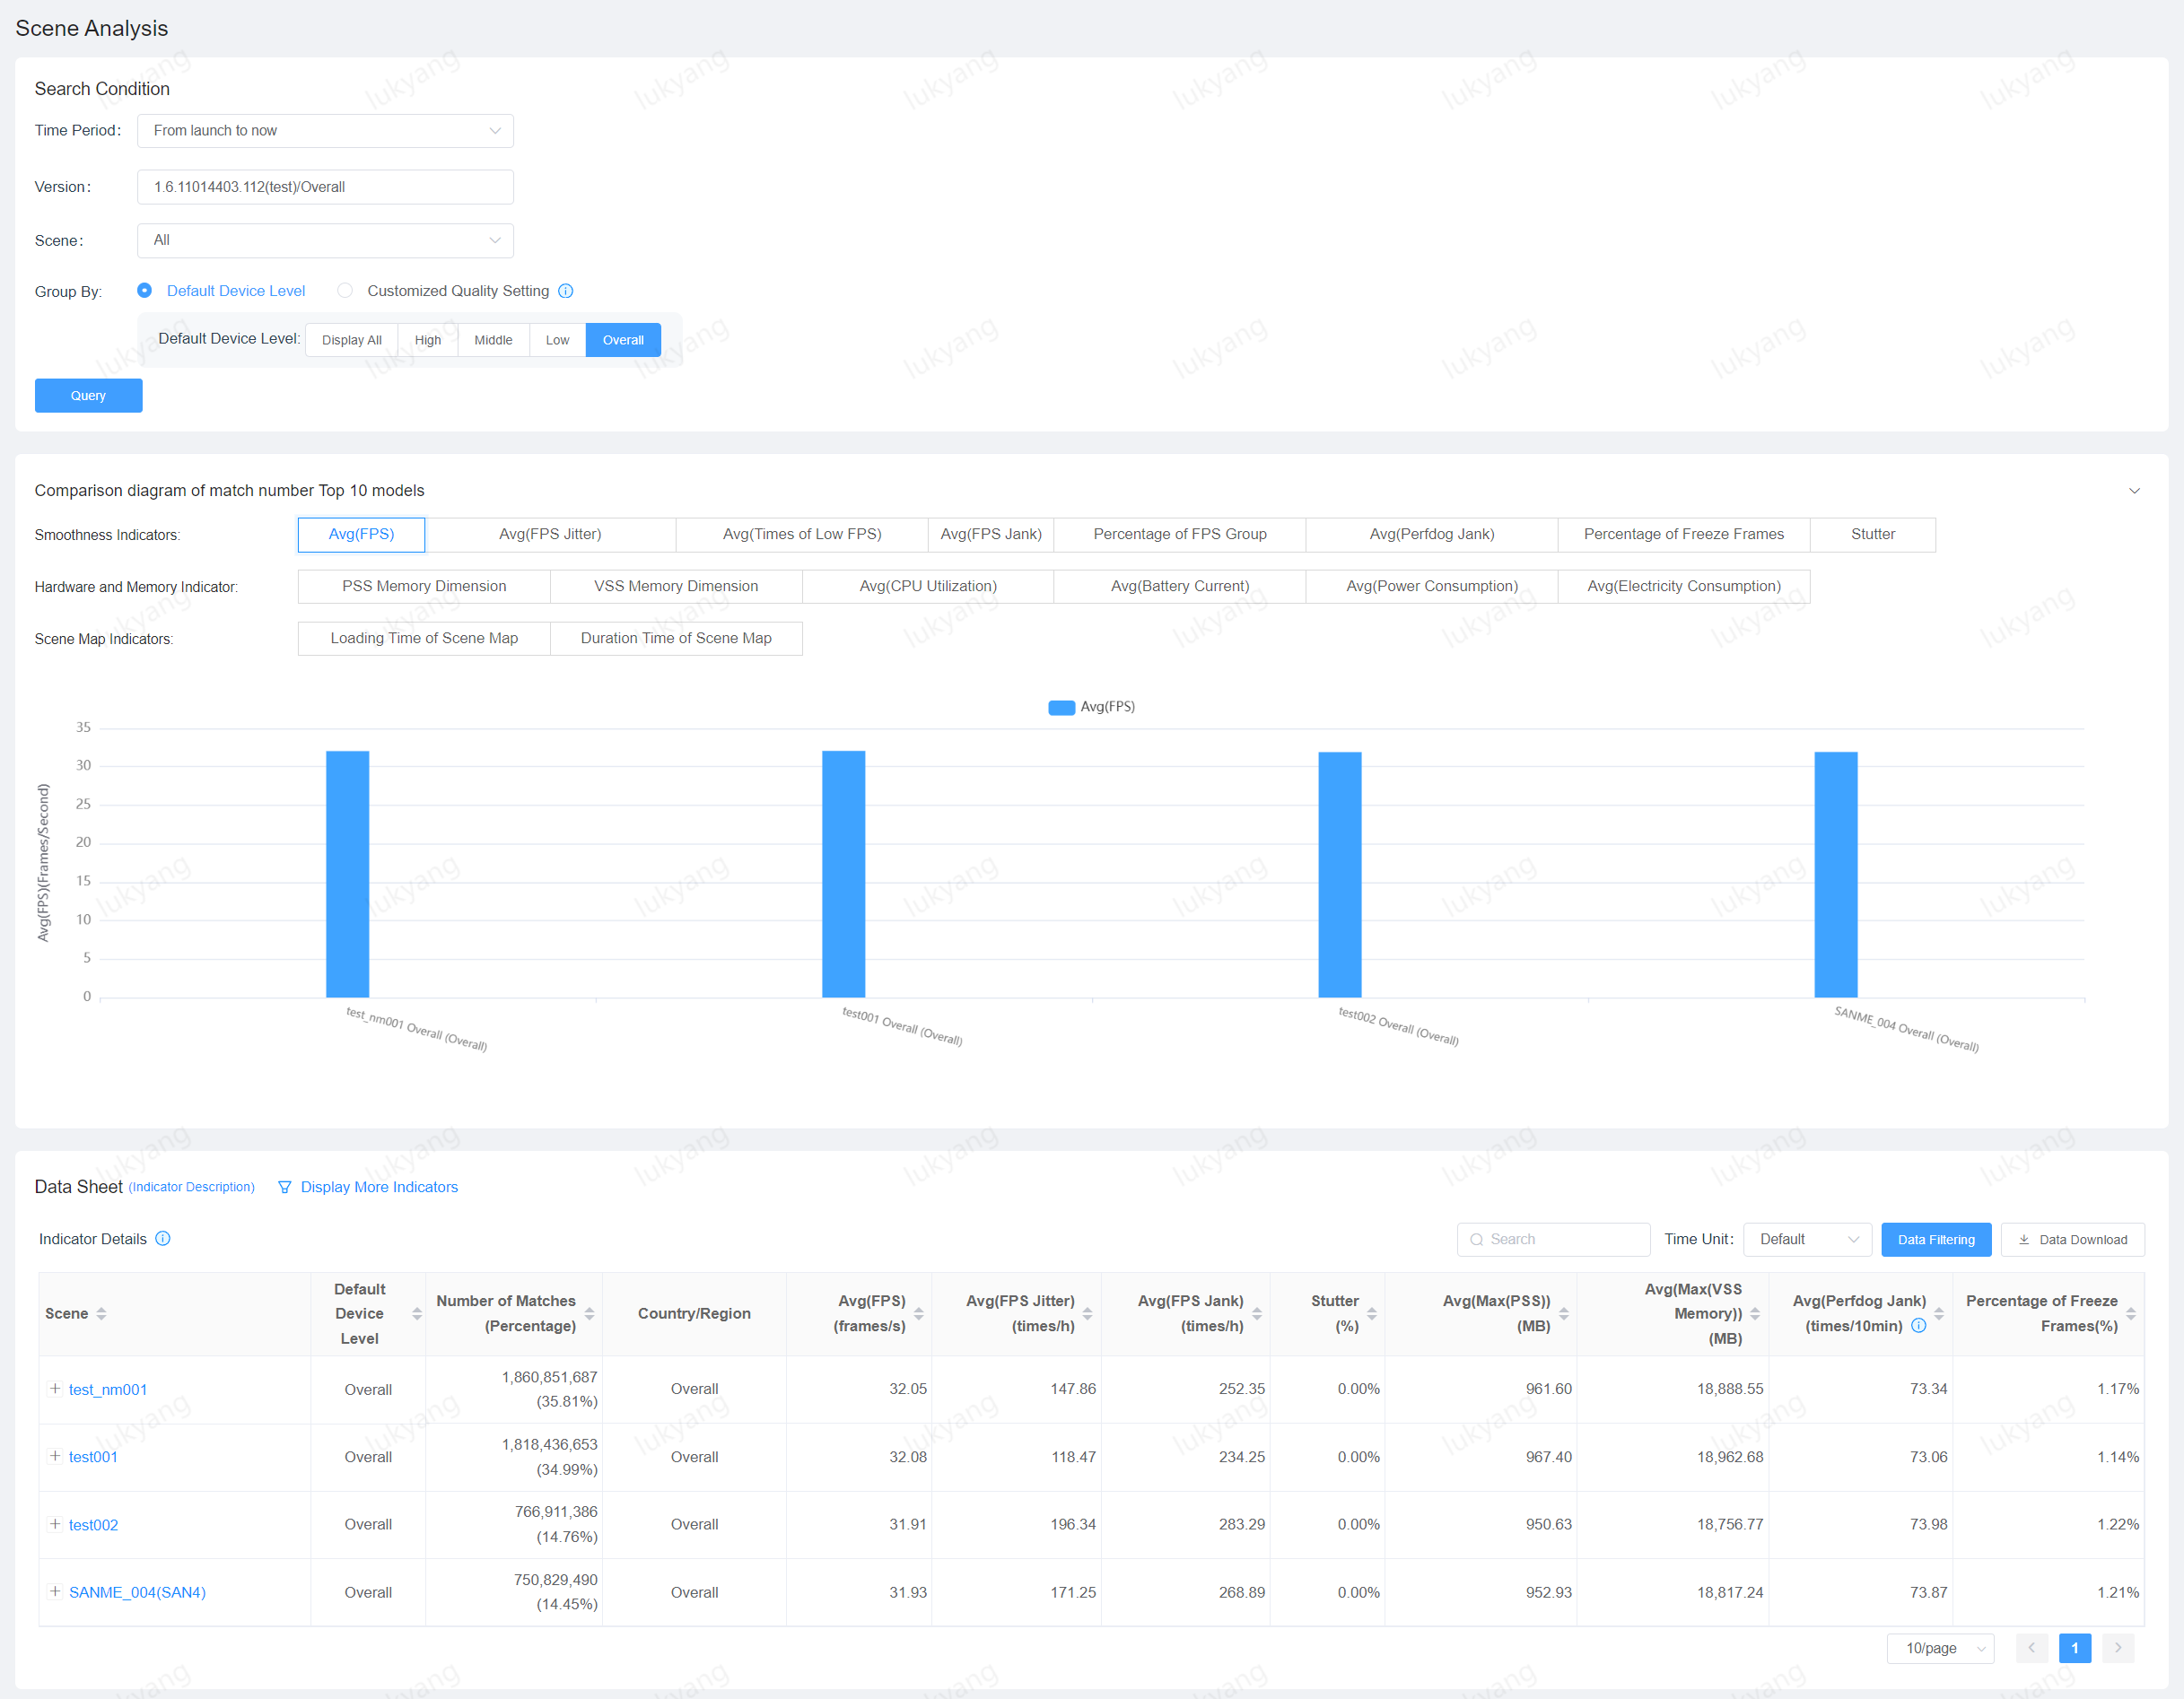
3.3 Device Analysis
Device Analysis Page can query the performance data in the version, scene, GPU, SoC, and model dimensions. The query supports version cycle or custom time cycle as the unit. 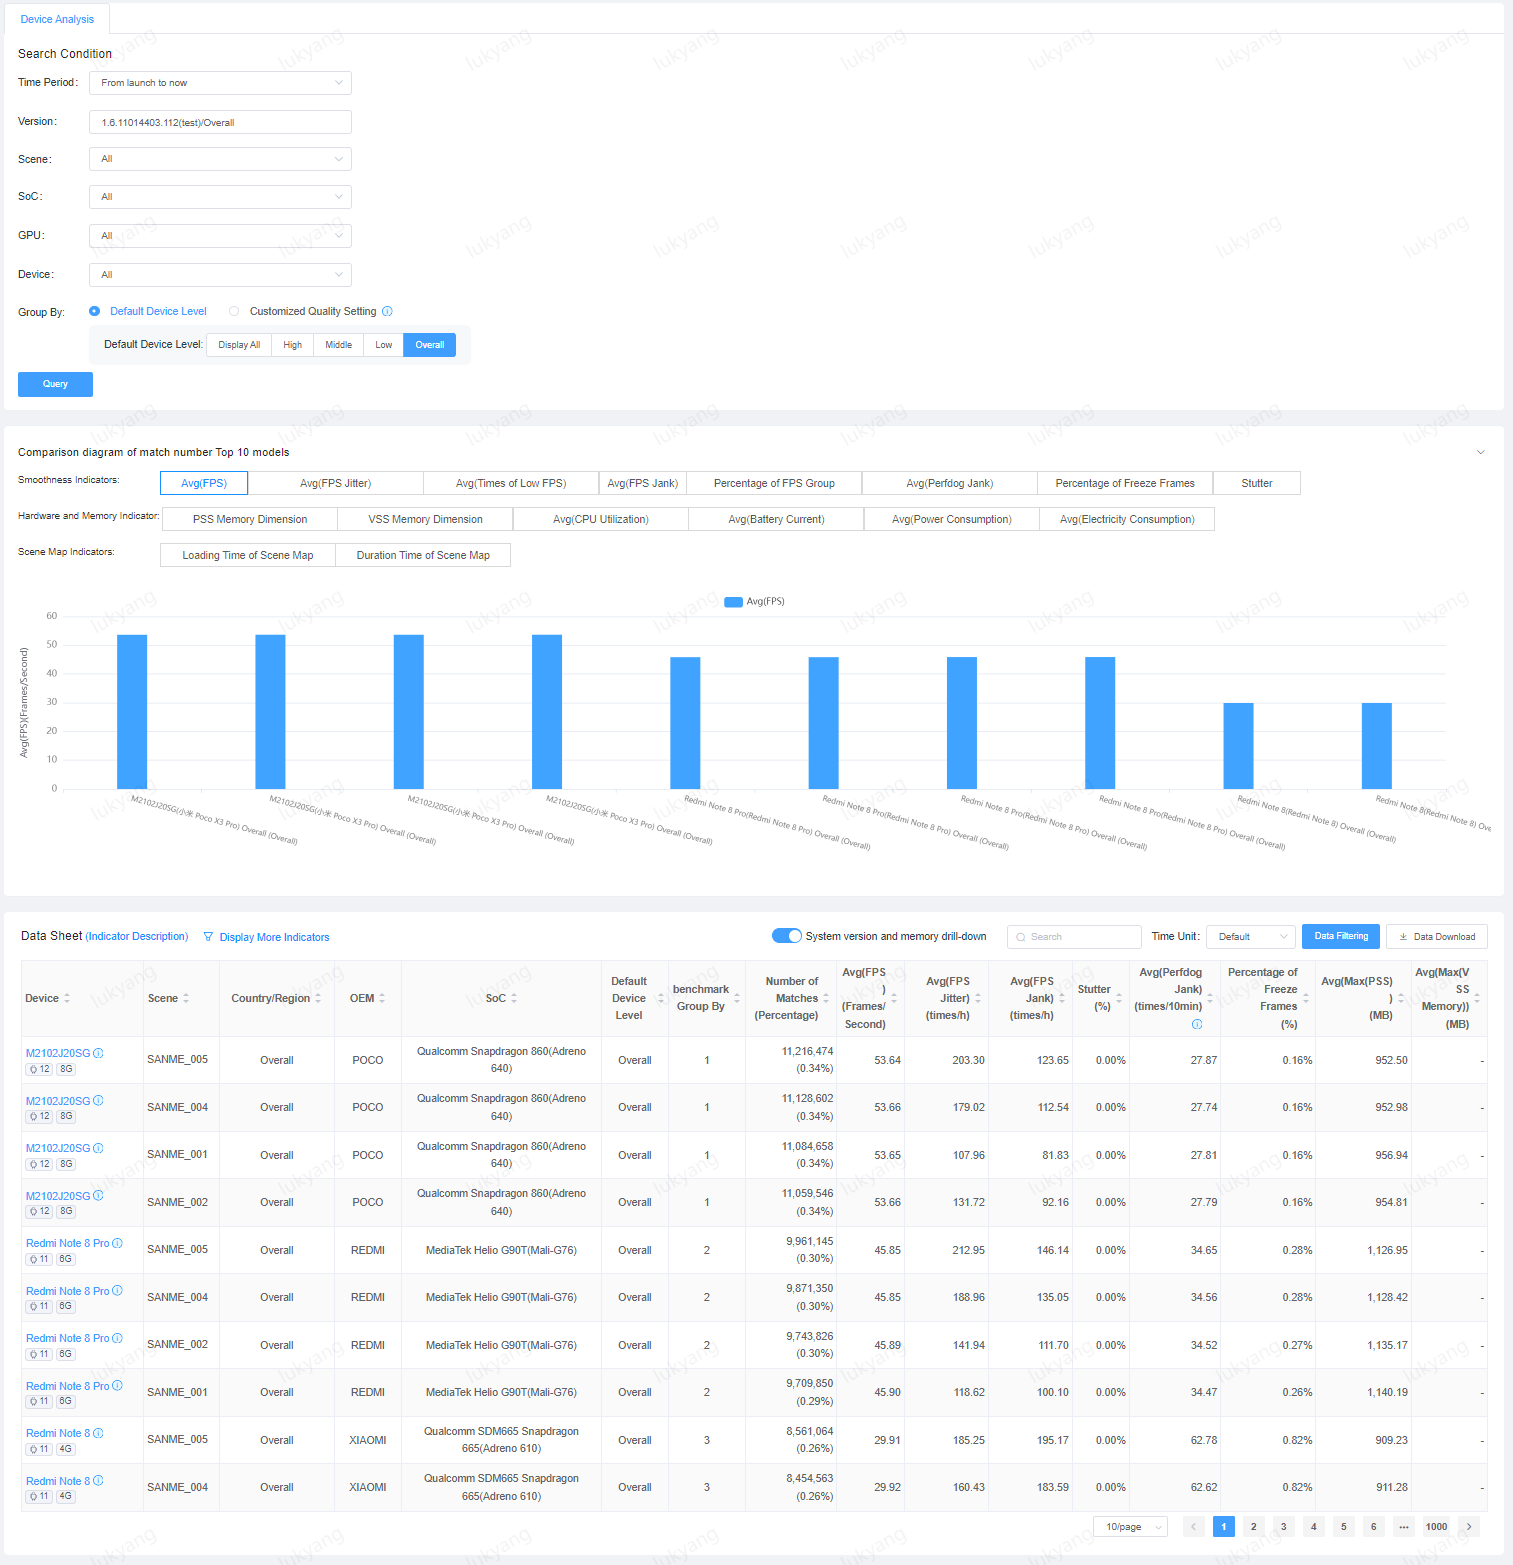
3.4 SoC Analysis
SoC Analysis Page can query the performance data in the version, scene, and SoC dimensions. The query supports version cycle or custom time cycle as the unit. 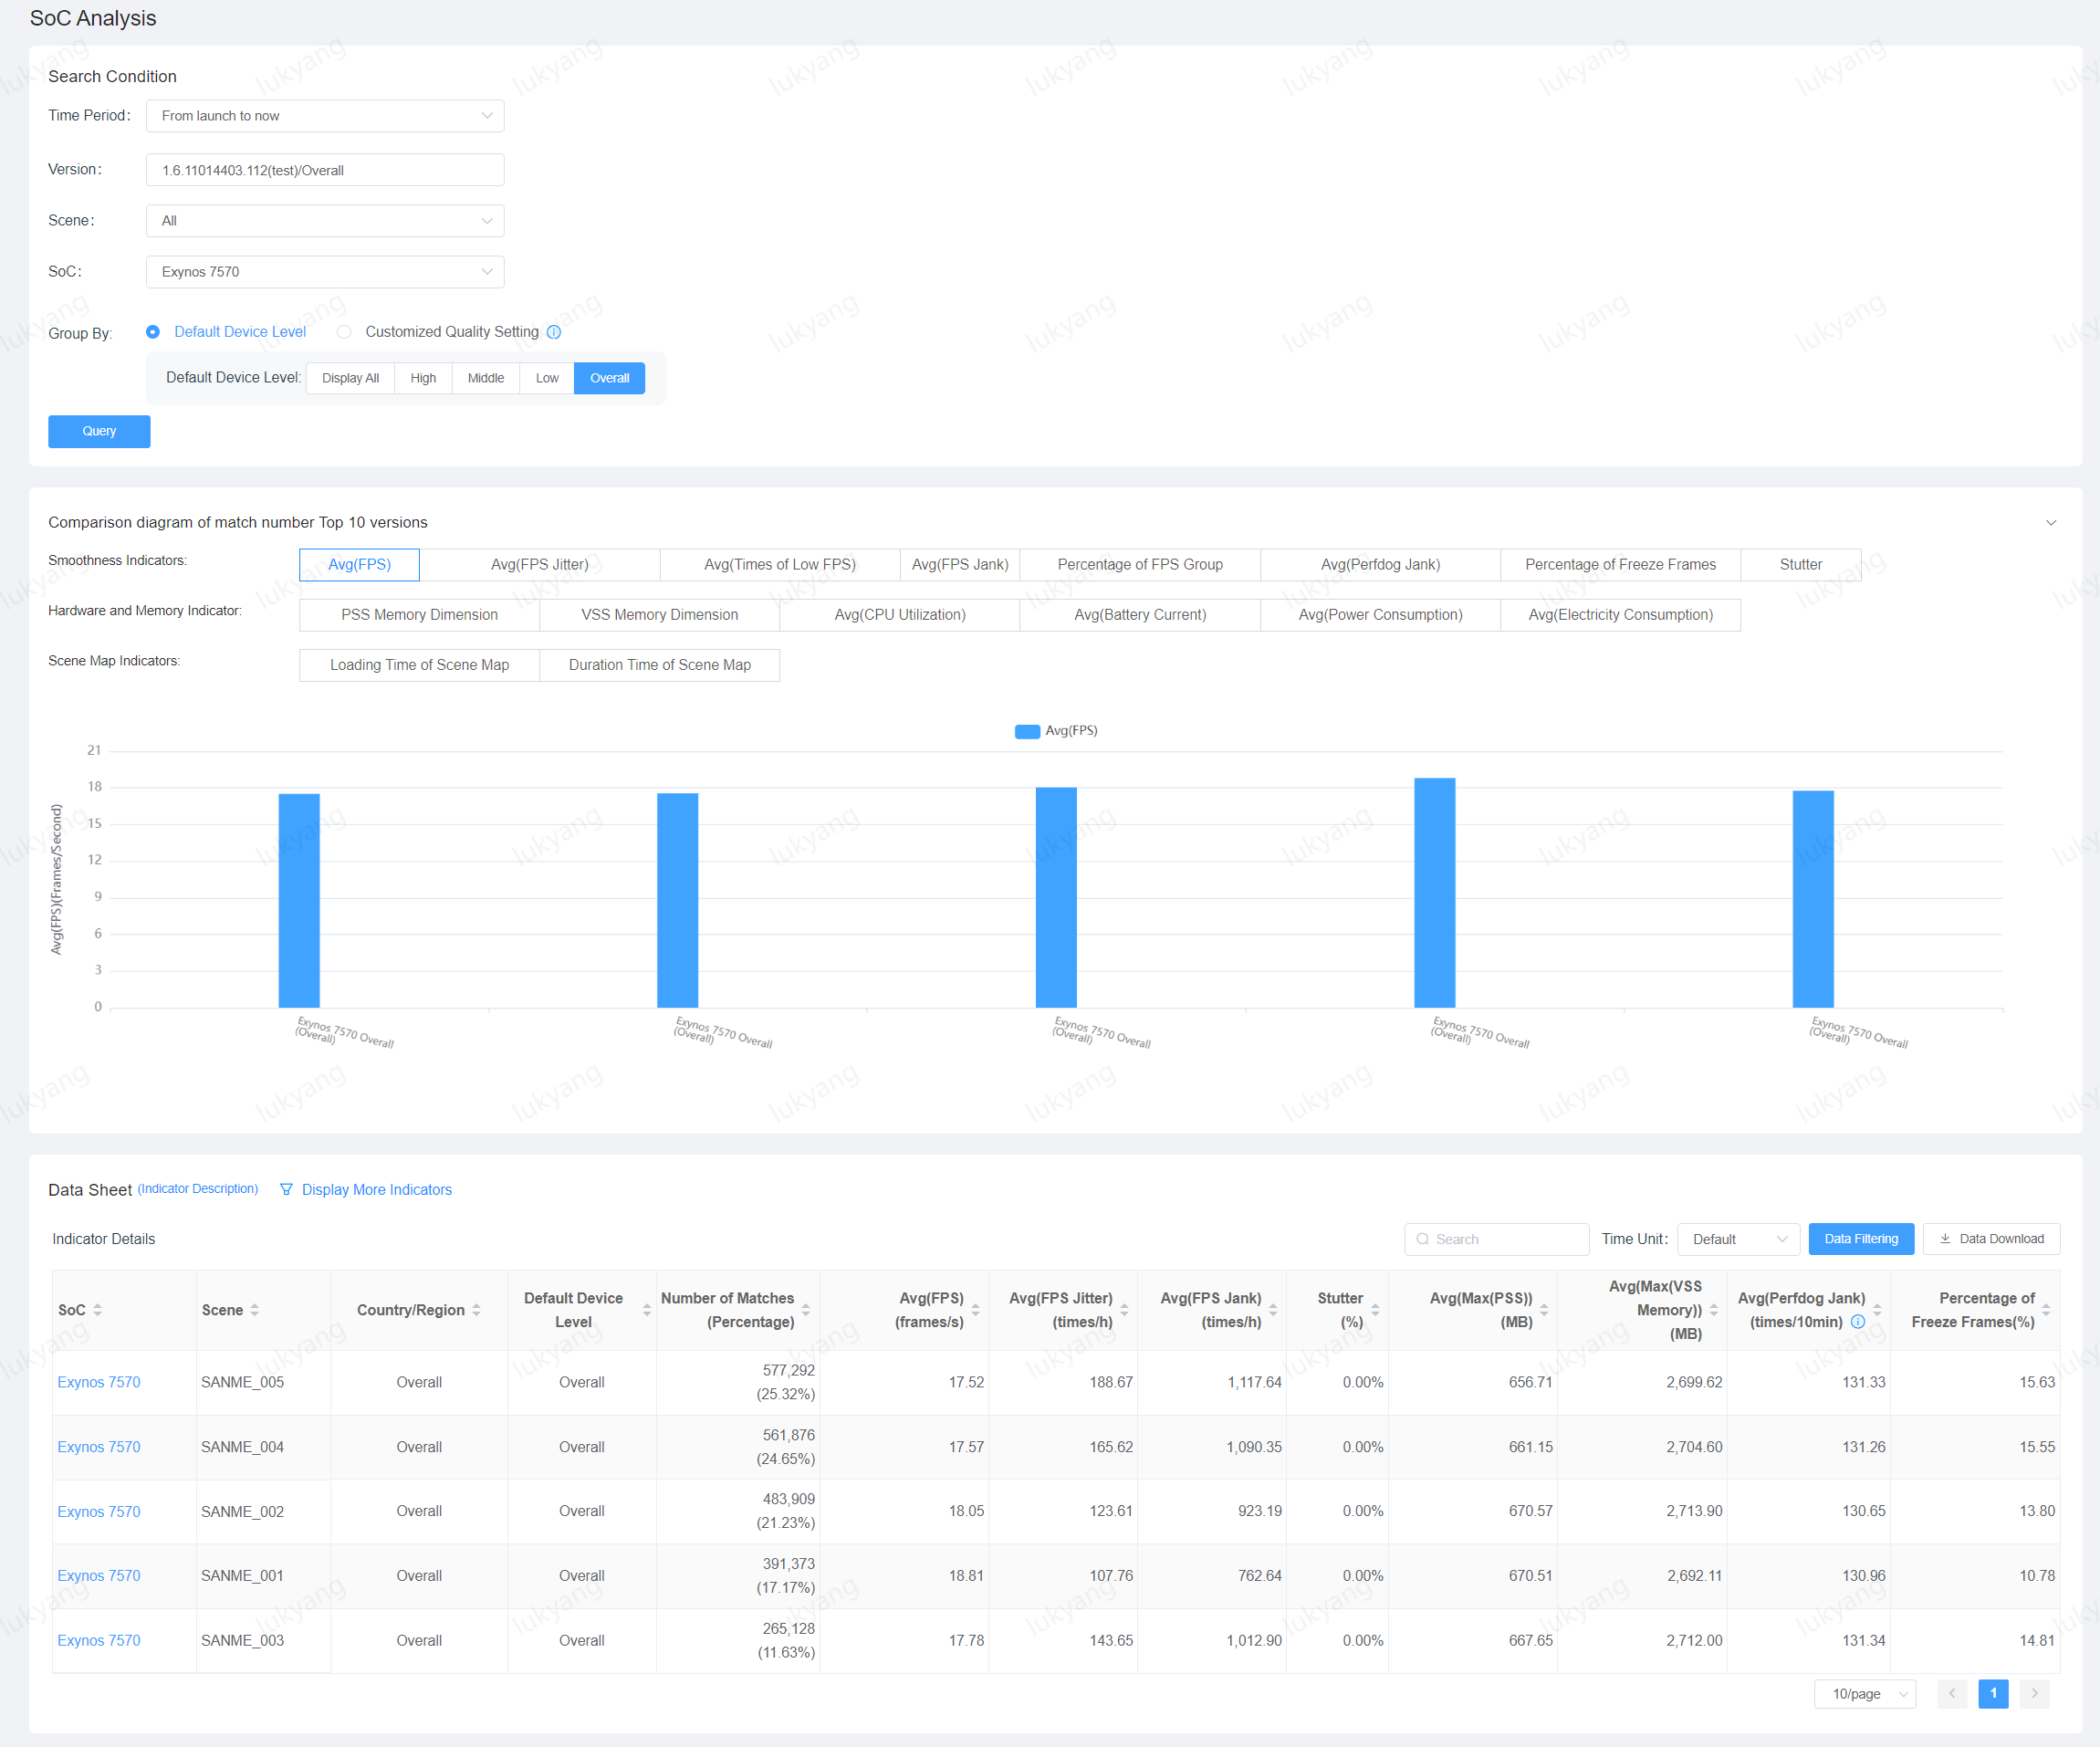
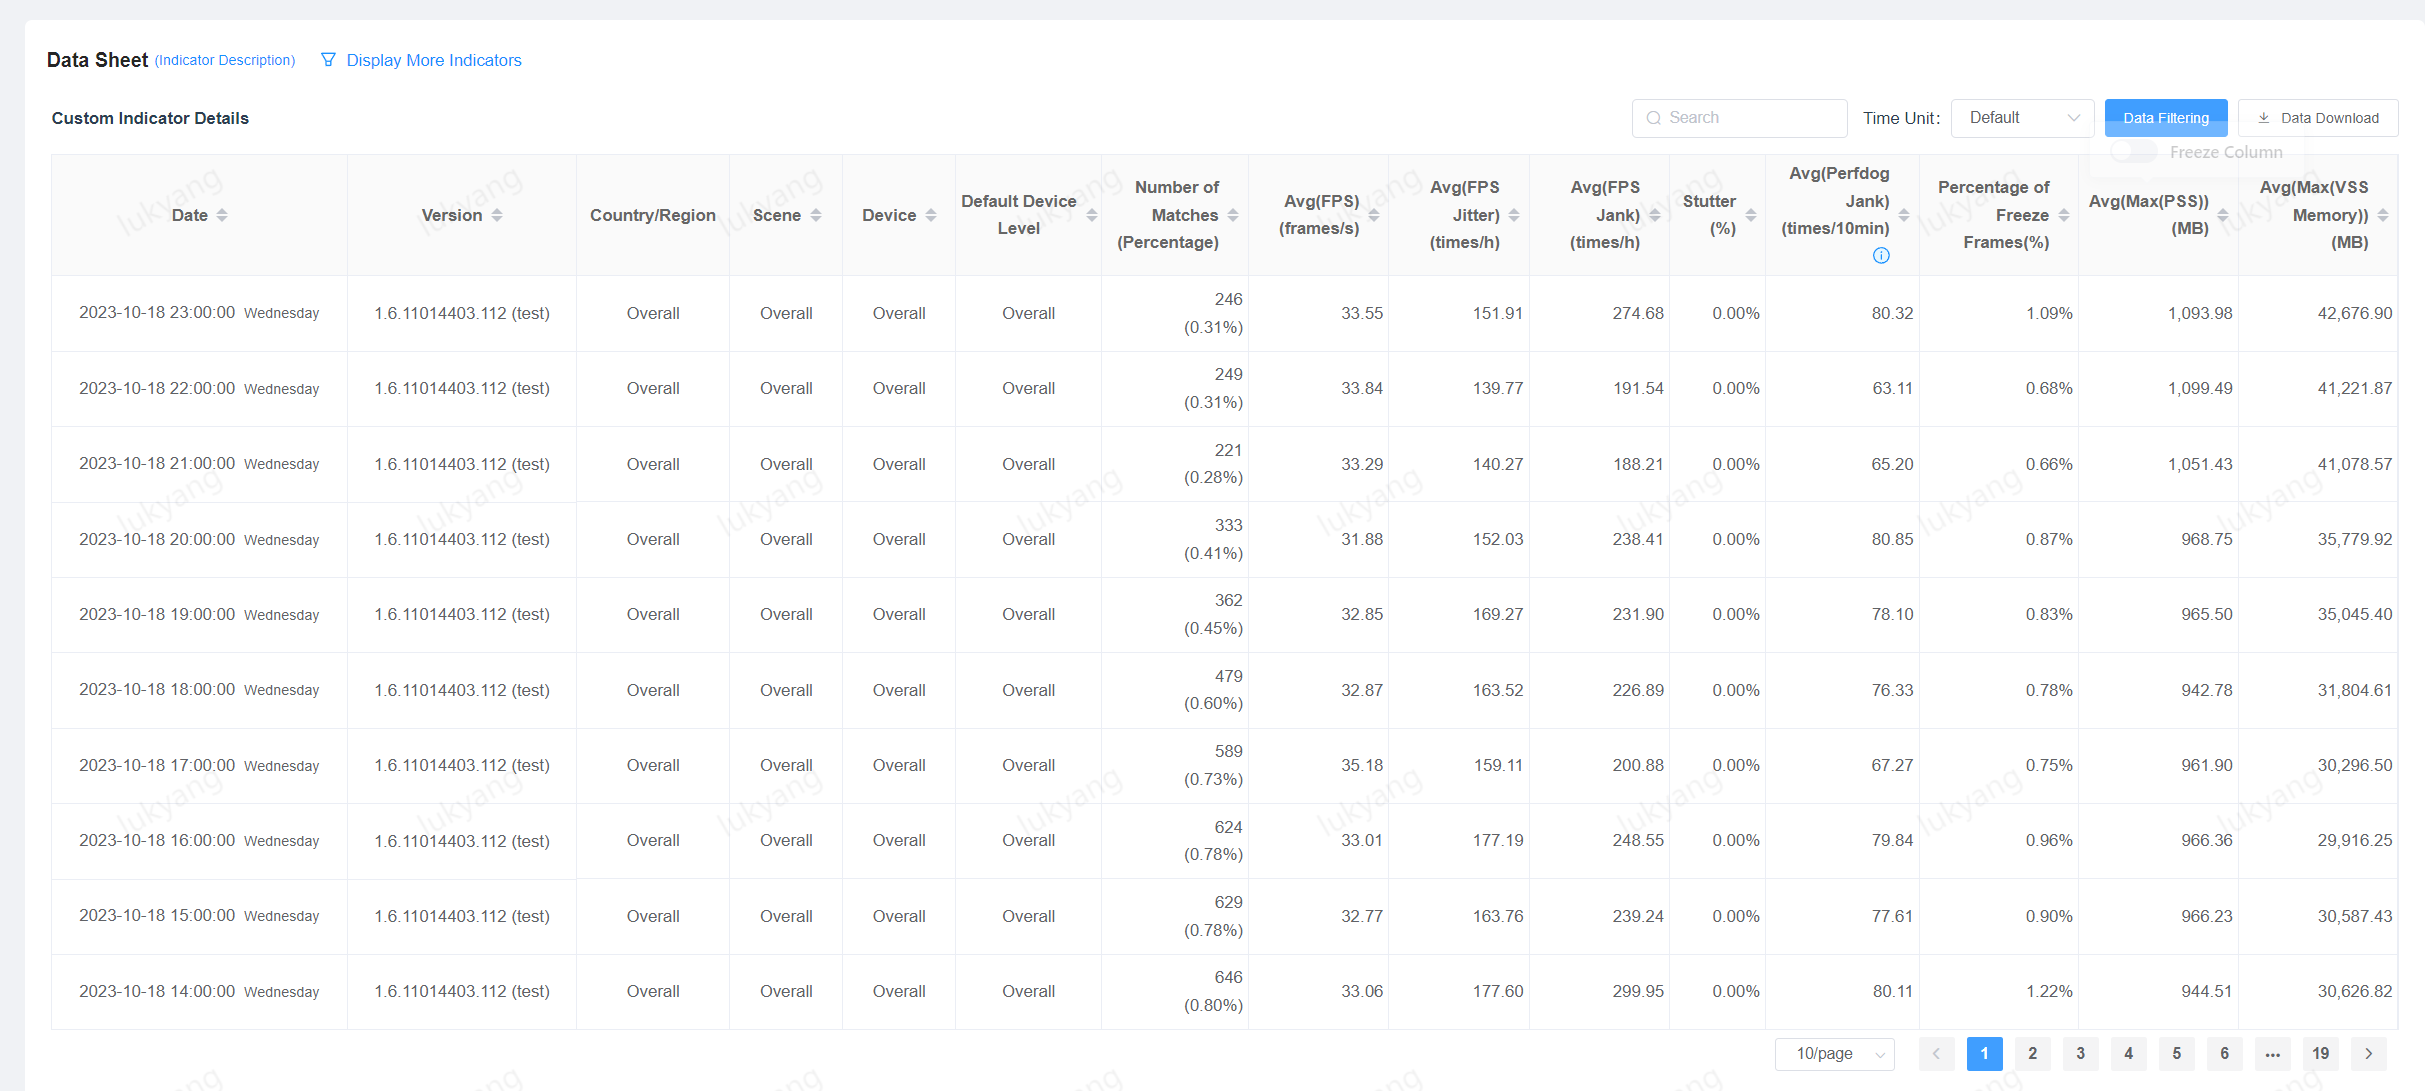
4. Performance Trend
Performance Trend Page can query daily and hour-level performance data in the version, scene, and model dimensions. 
5. Comparison Analysis
The Comparison Analysis Page includes Version Comparison, Scene Comparison, and Multi-Version Comparison.
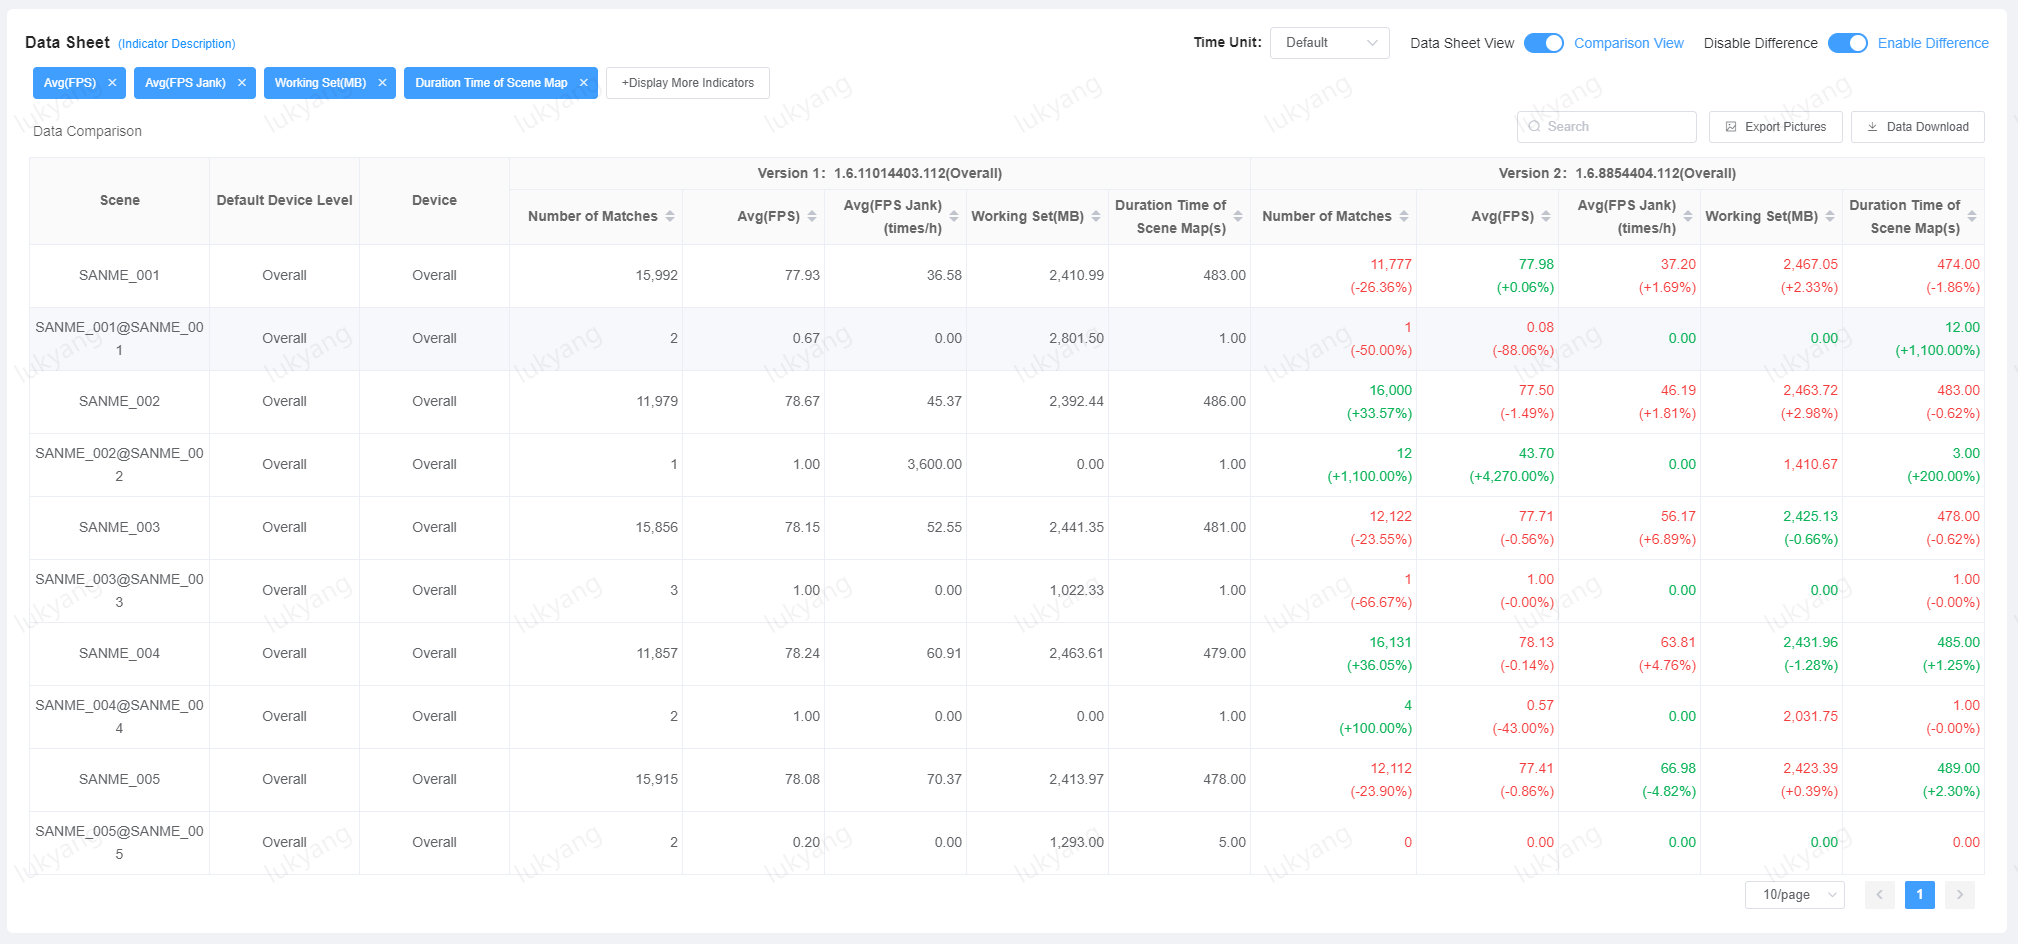
Version Comparison
Version Comparison Page can choose any two versions, choose the core game scenes of concern, and conduct a comparative analysis. The query supports version cycle or custom time cycle as the unit. 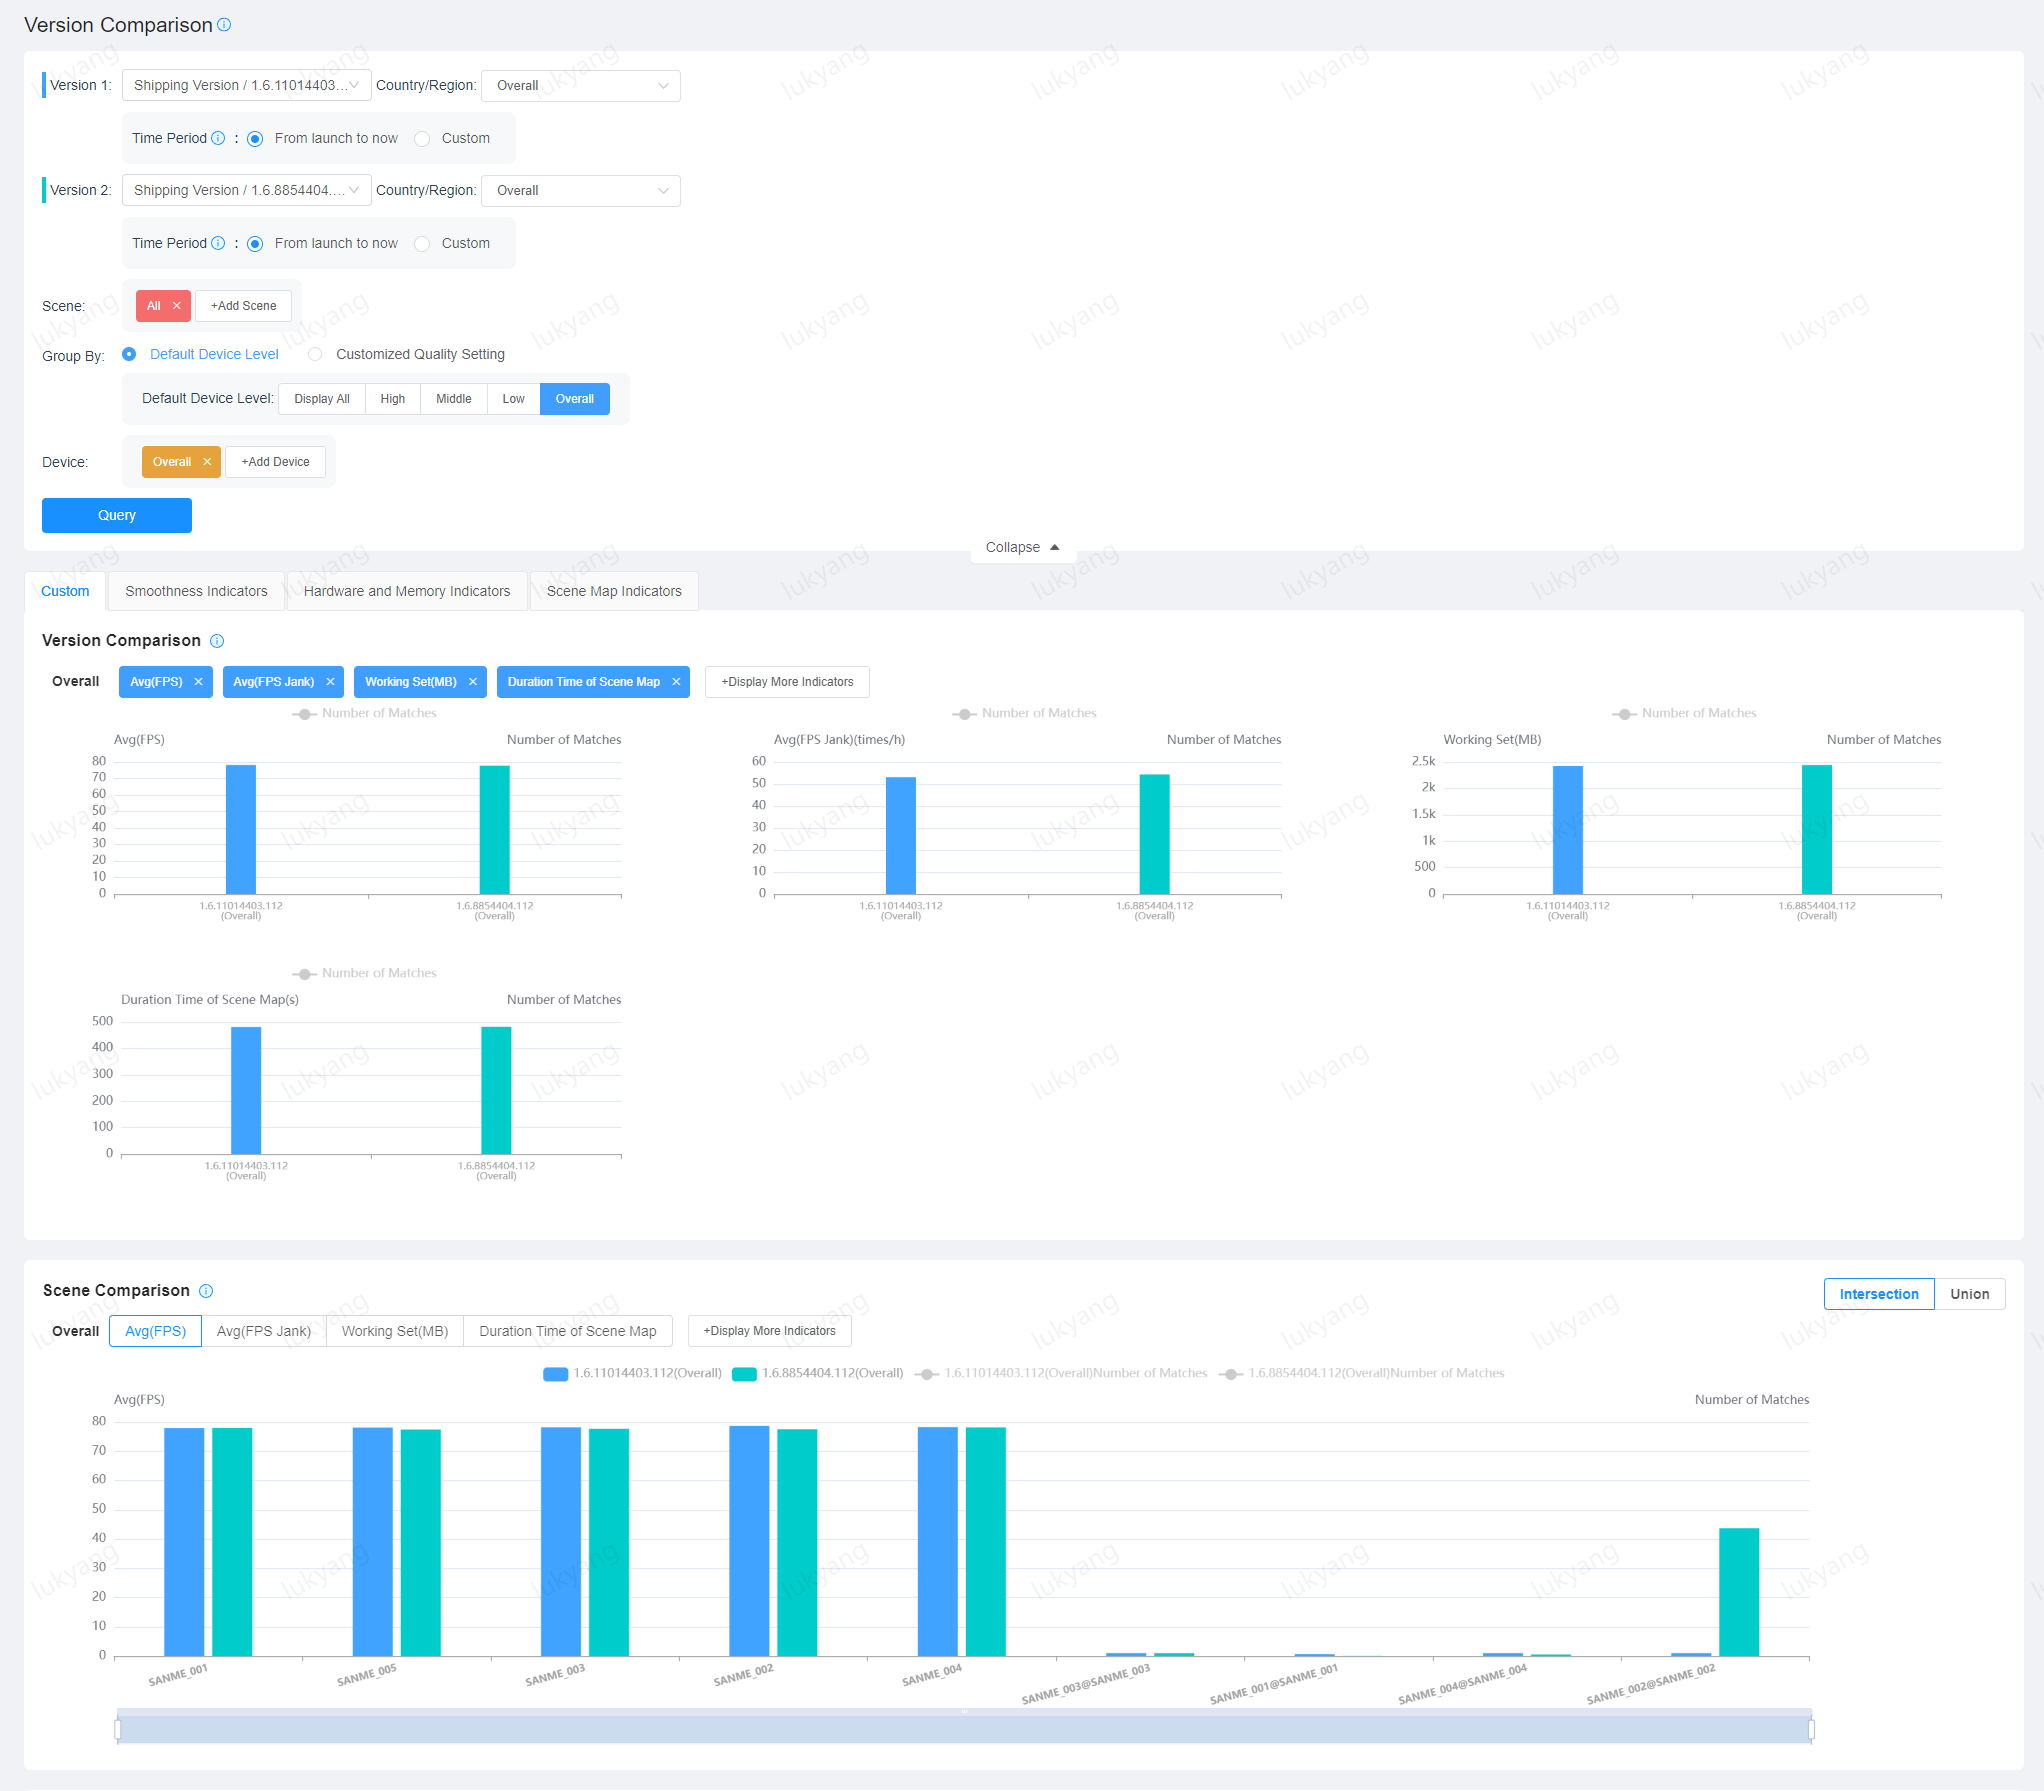
Scene Comparison
Scene Comparison Page can select any two scenes for comparative analysis on specific models. The query supports version cycle or custom time cycle as the unit. 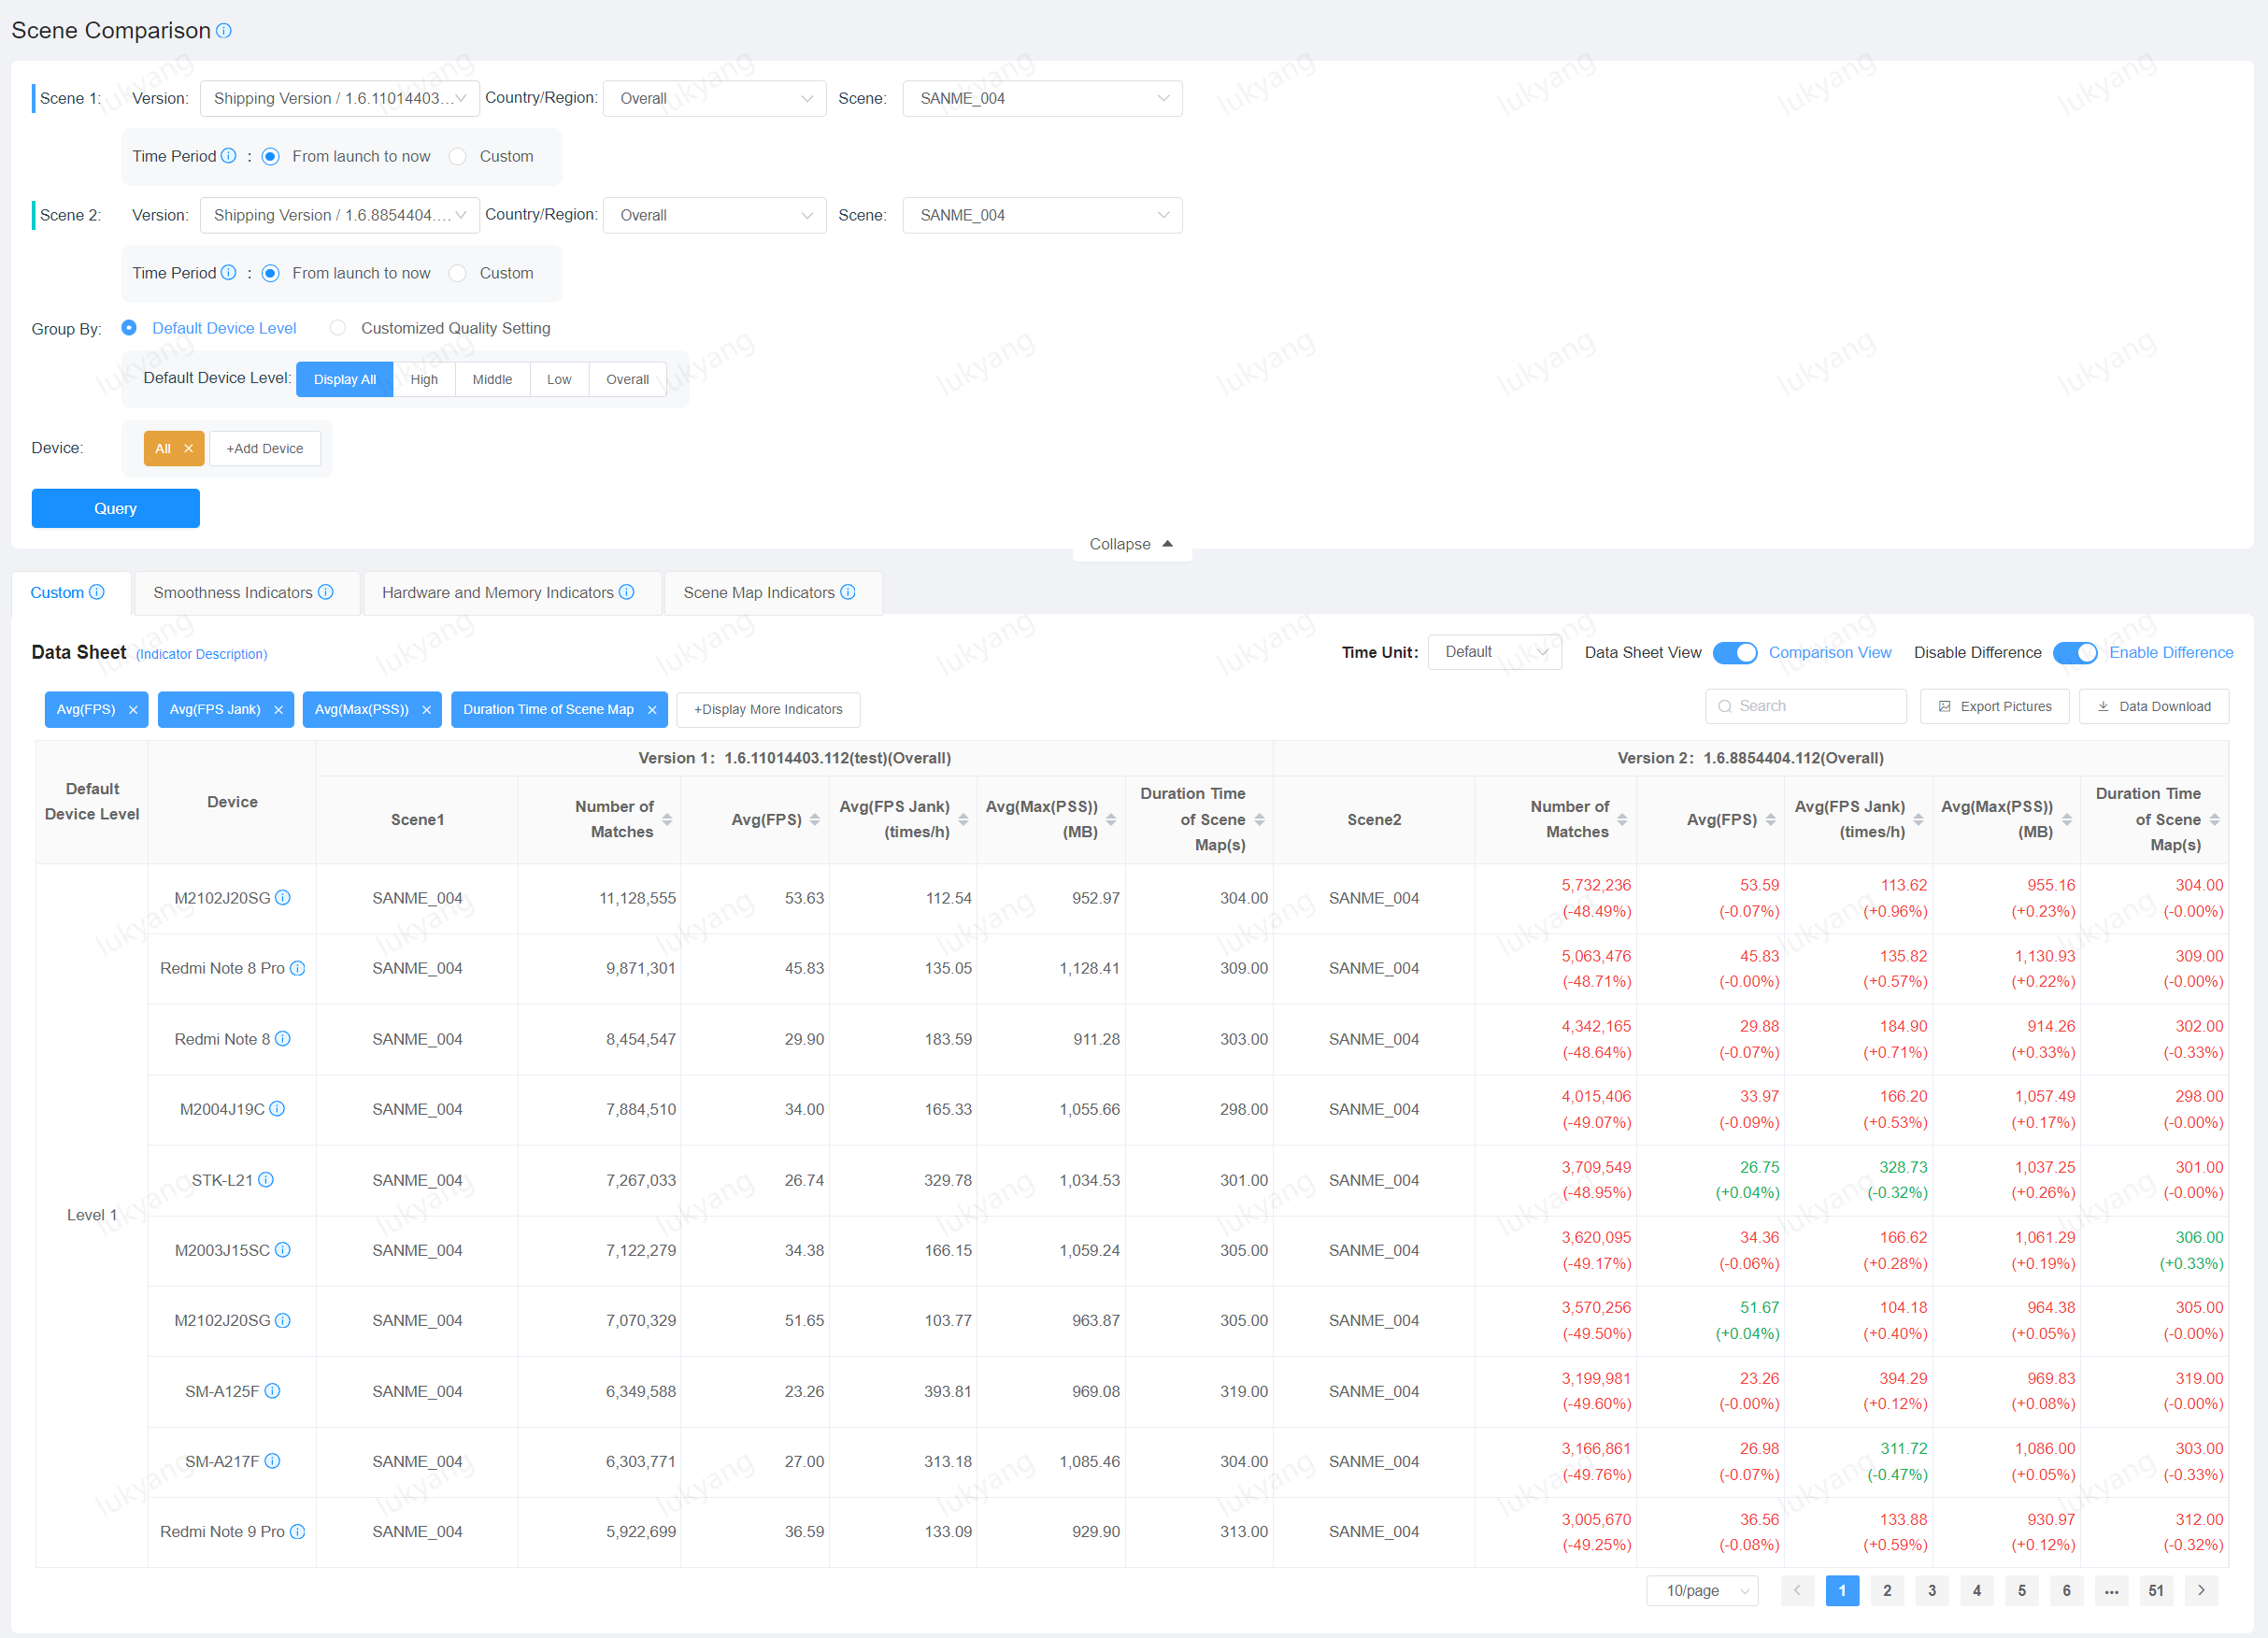
Multi-Version Comparison
Multi-Version Comparison Page can select multiple versions to perform comparative analysis on specific models and scenes. 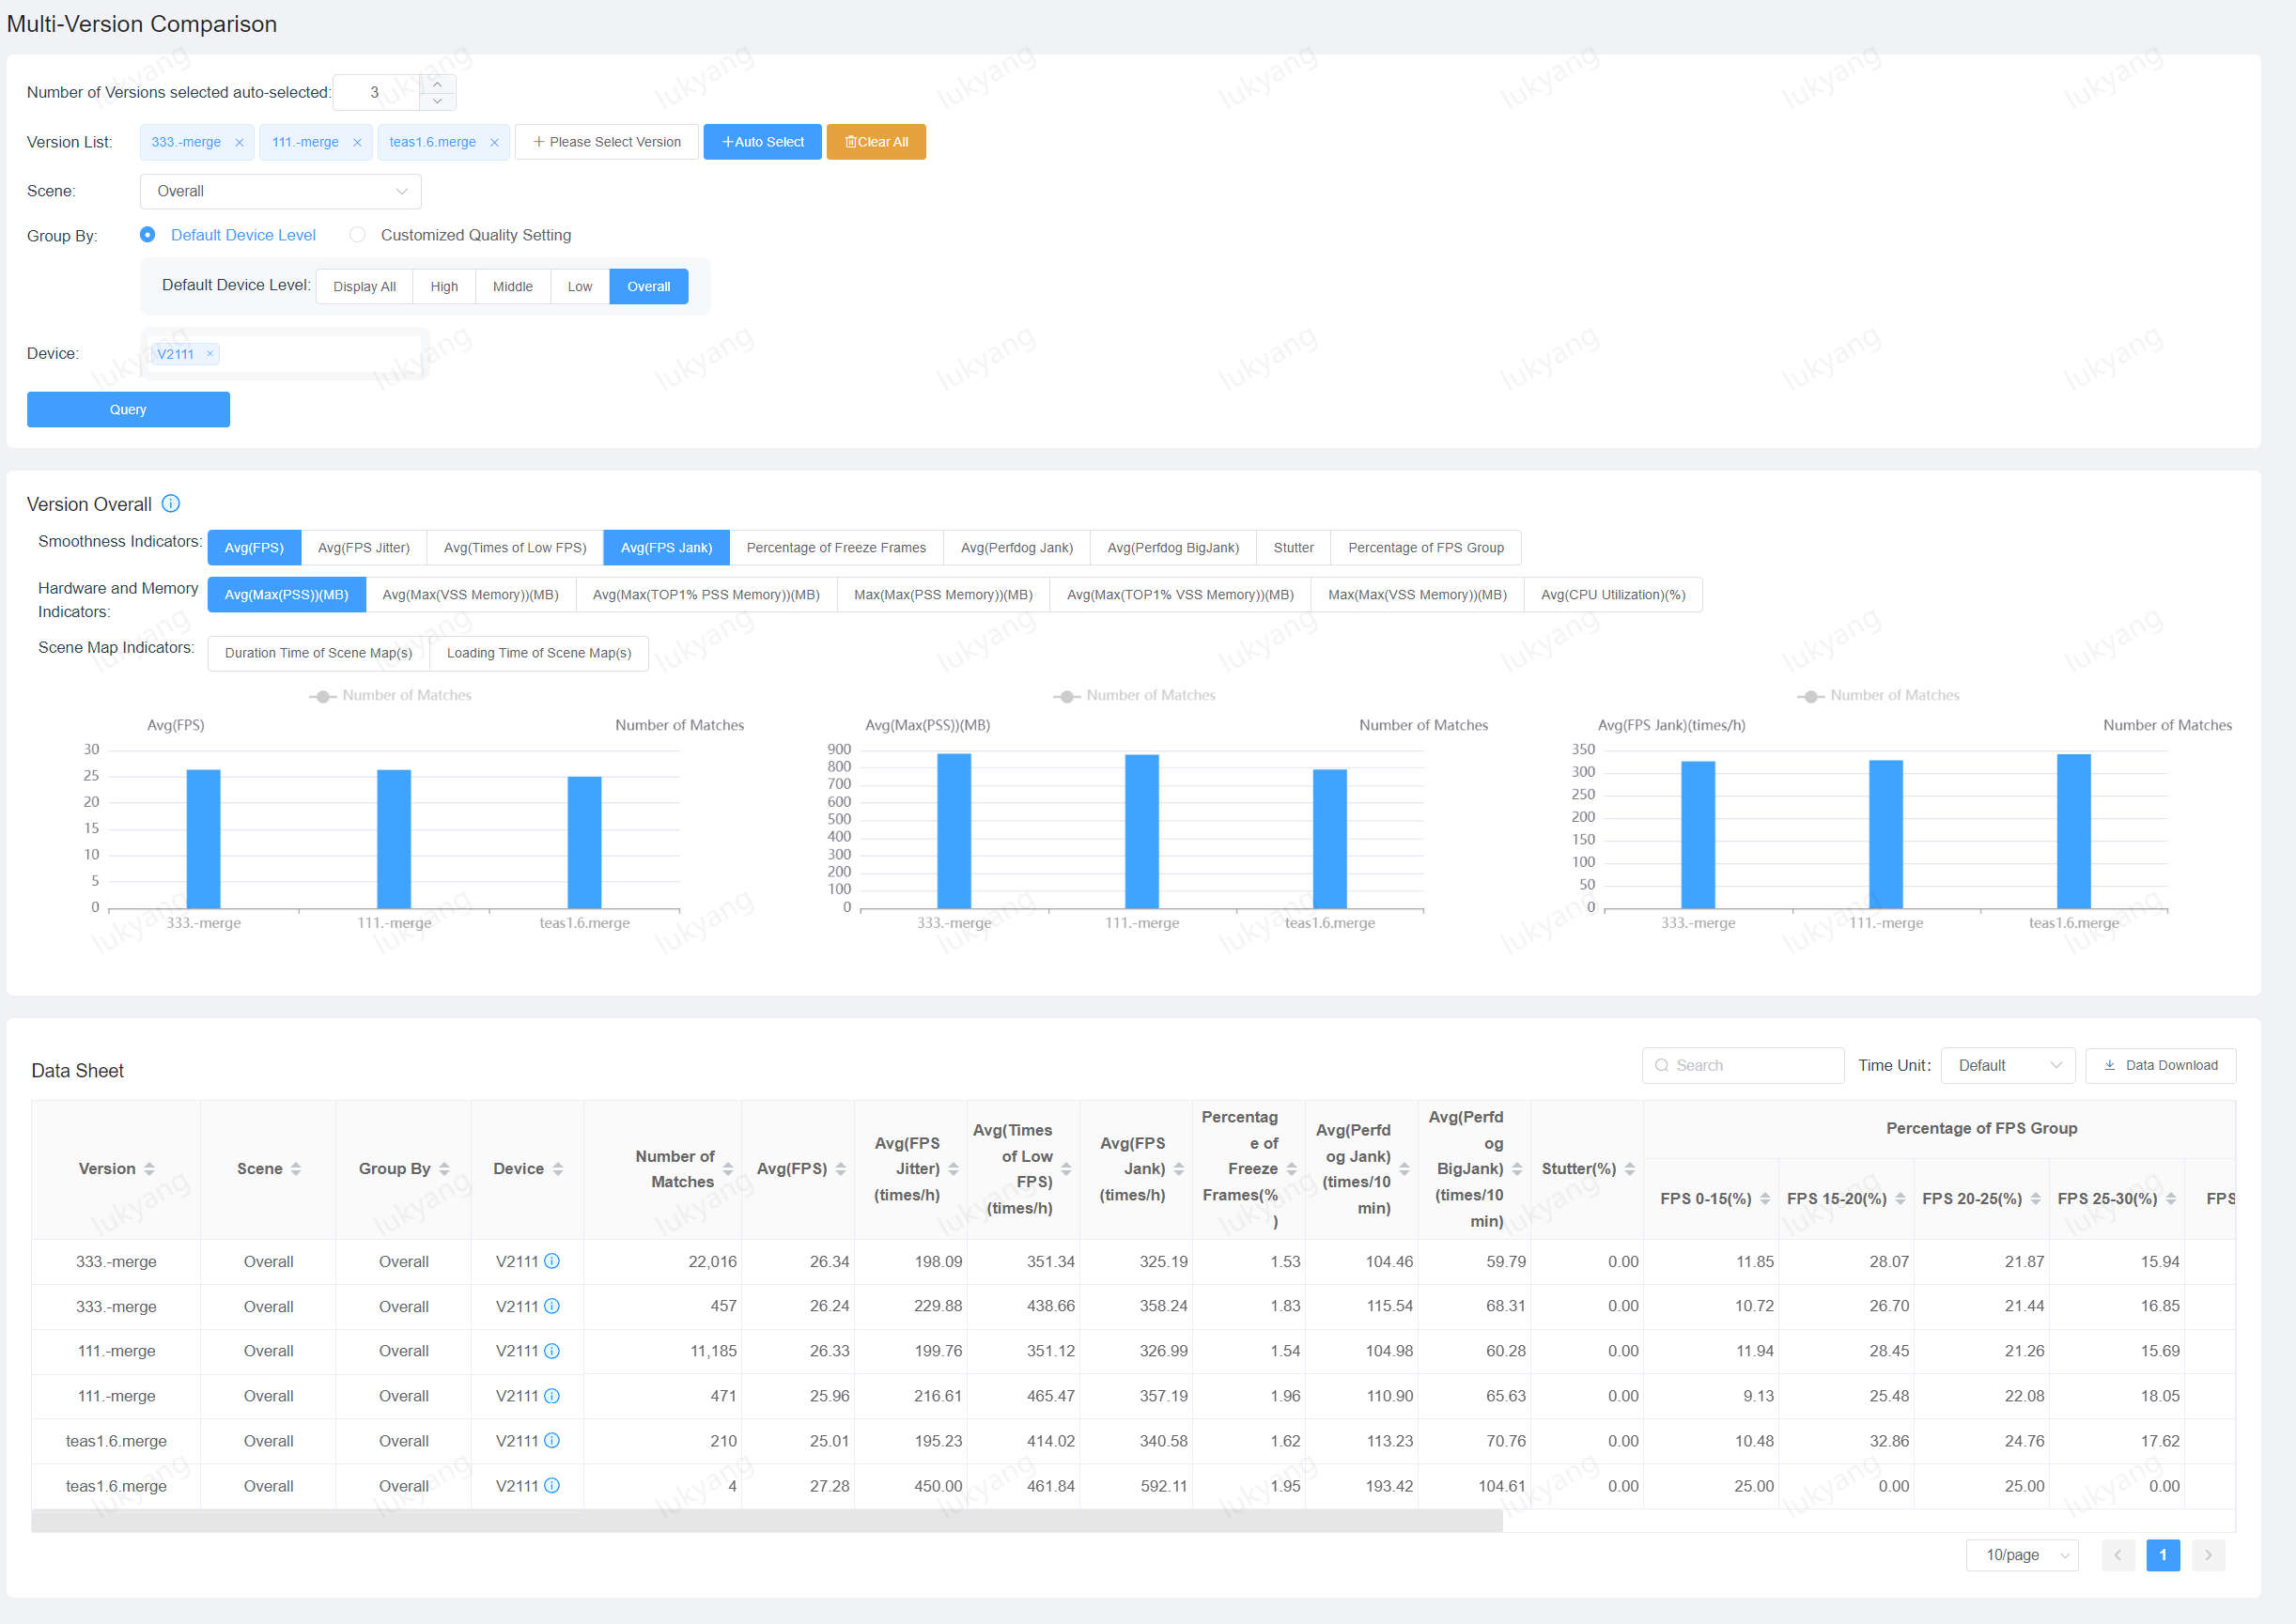
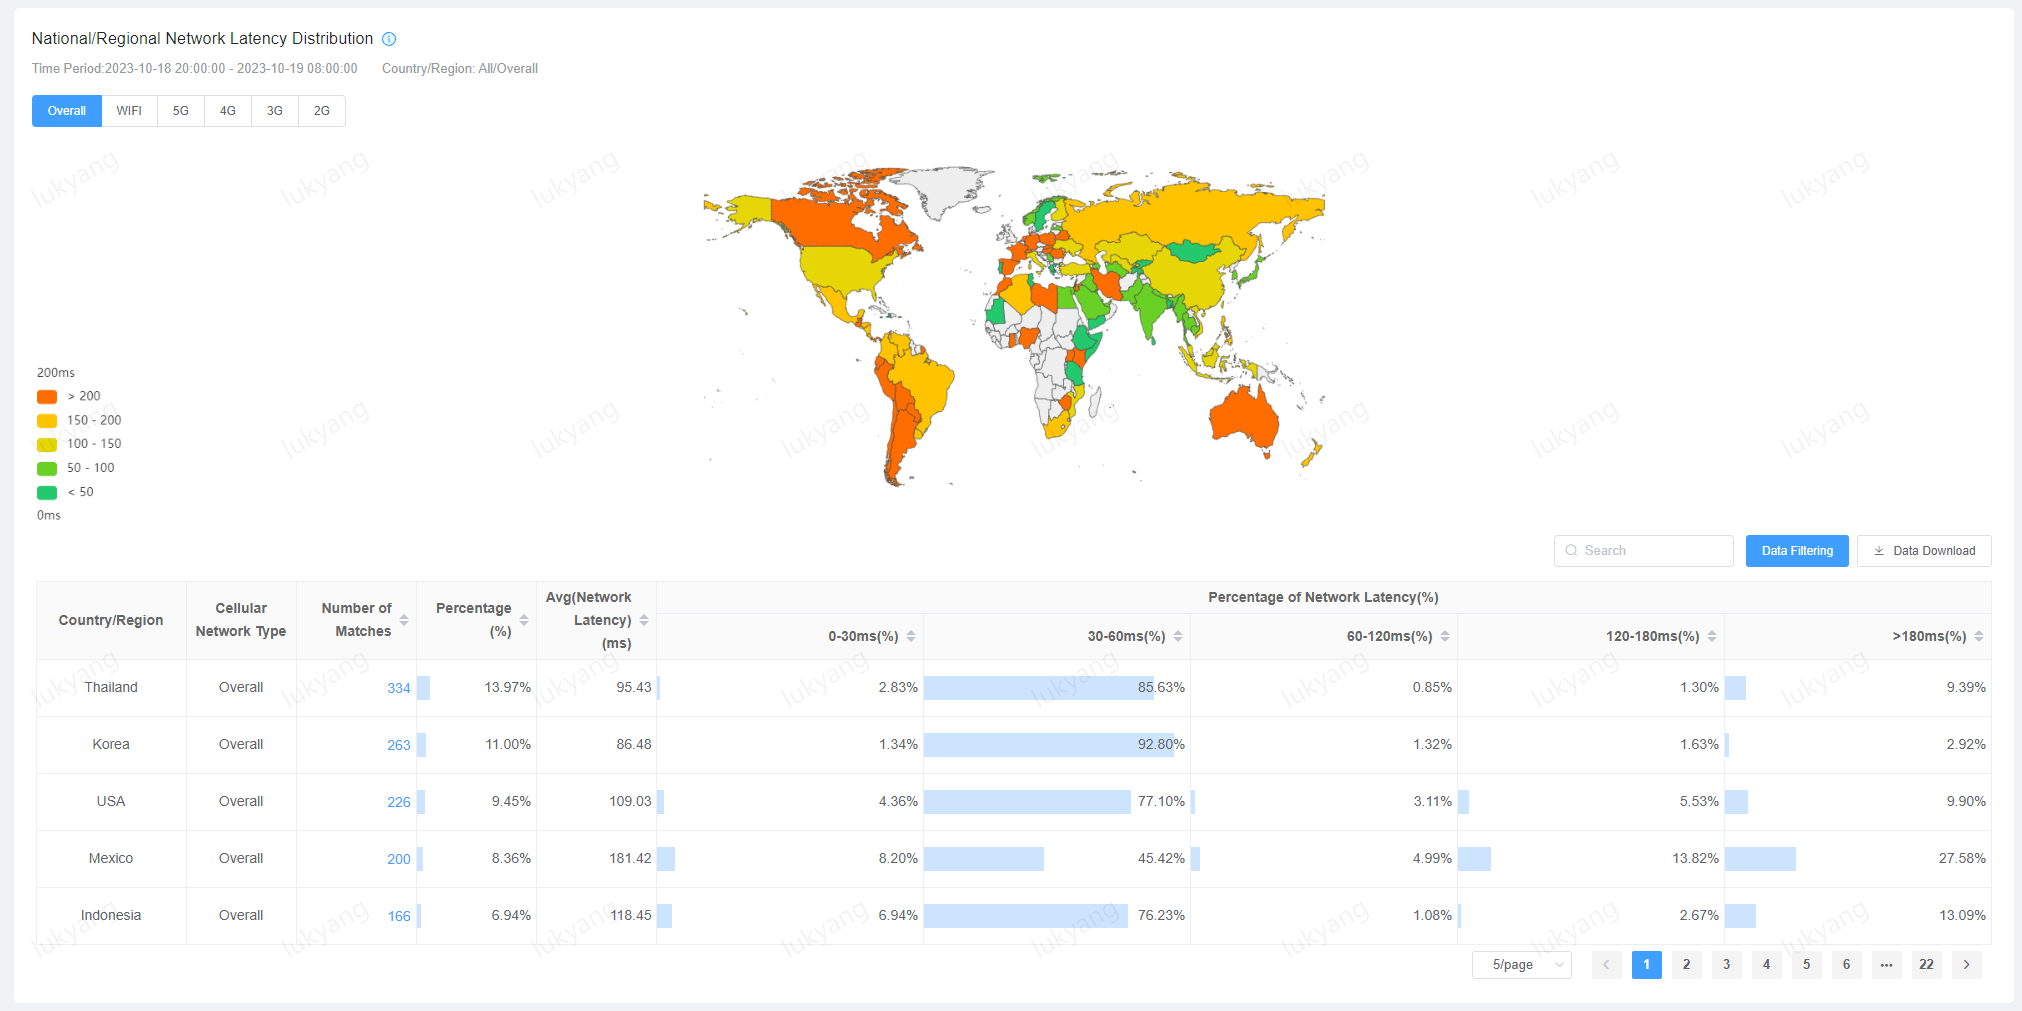
6. Network Latency
Network Latency Statistics Page
Network Latency Statistics Page allows you to view the latency status of the selected version in different countries and regions, and for different network types, helping developers to troubleshoot the impact of high network latency factors on game performance. 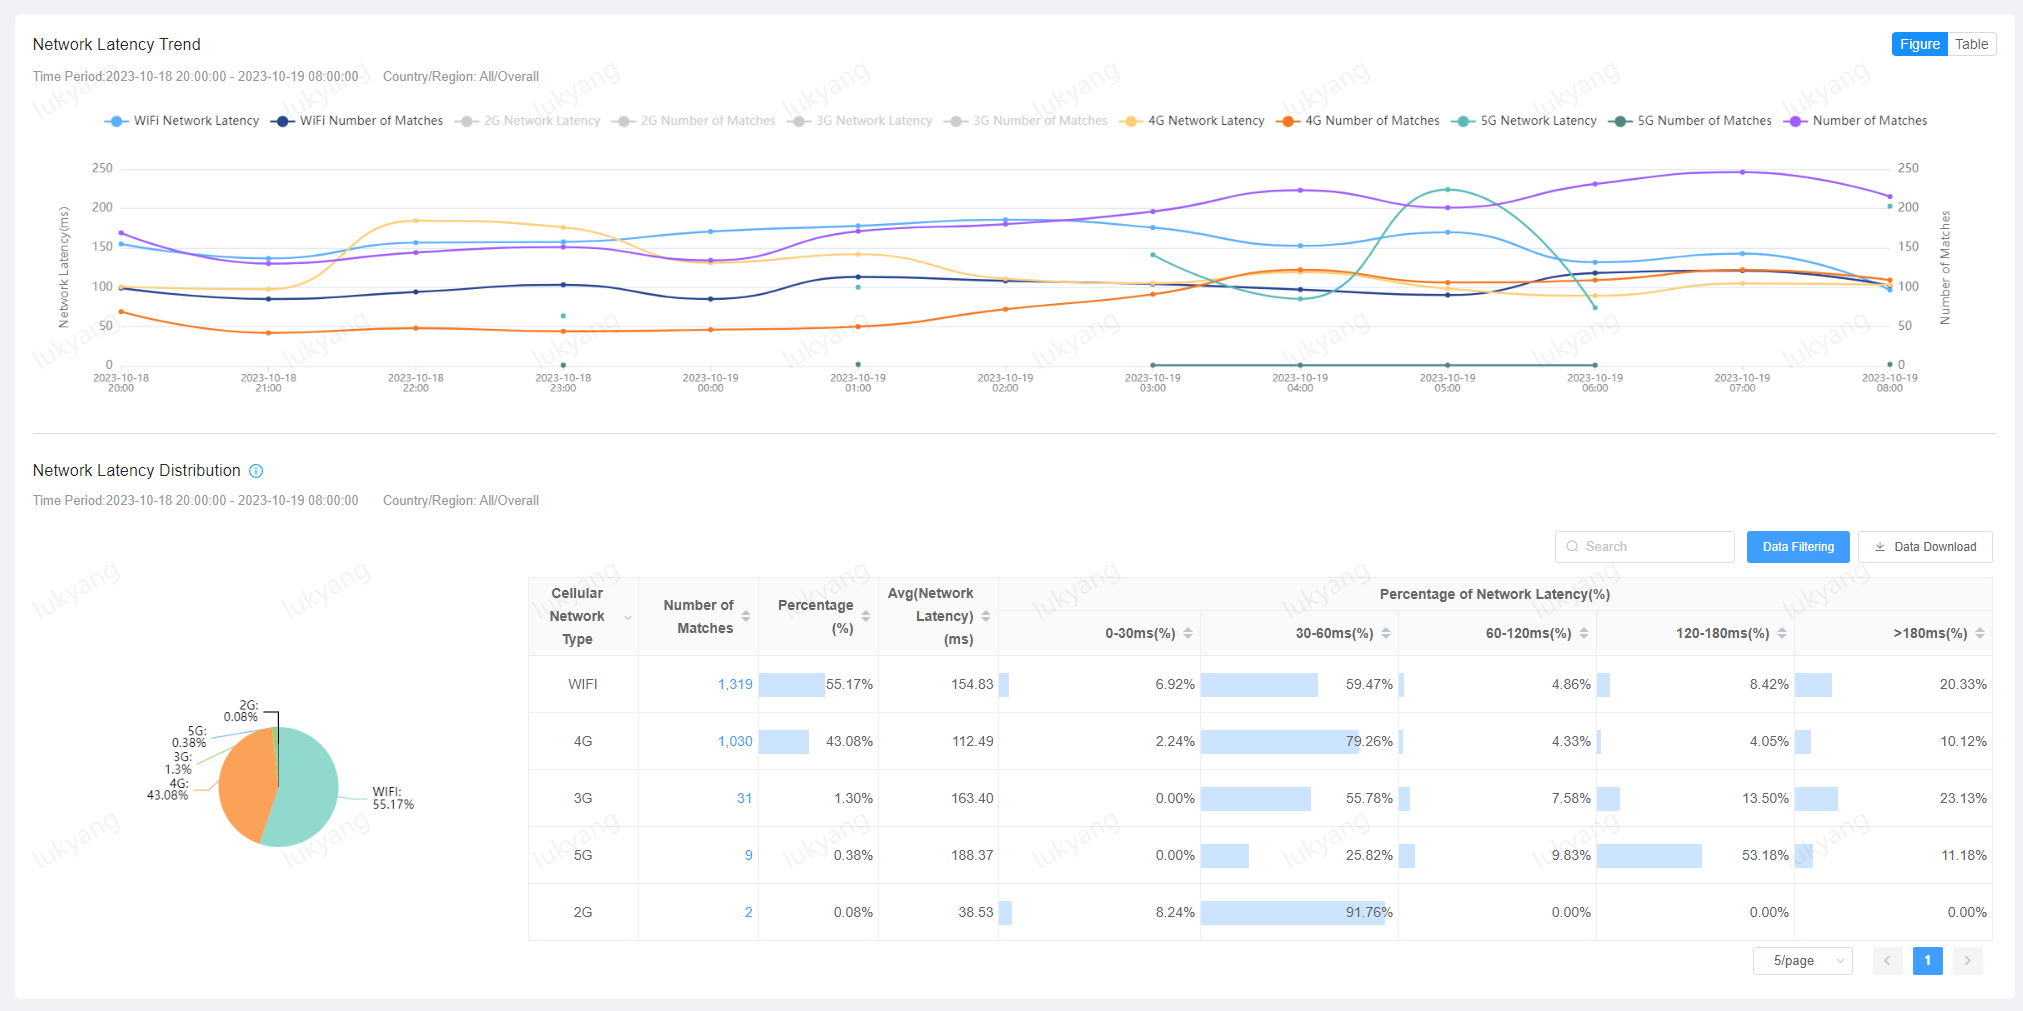
Network Latency Compare
The Network Latency Compare page allows you to compare network latency by country for different versions. 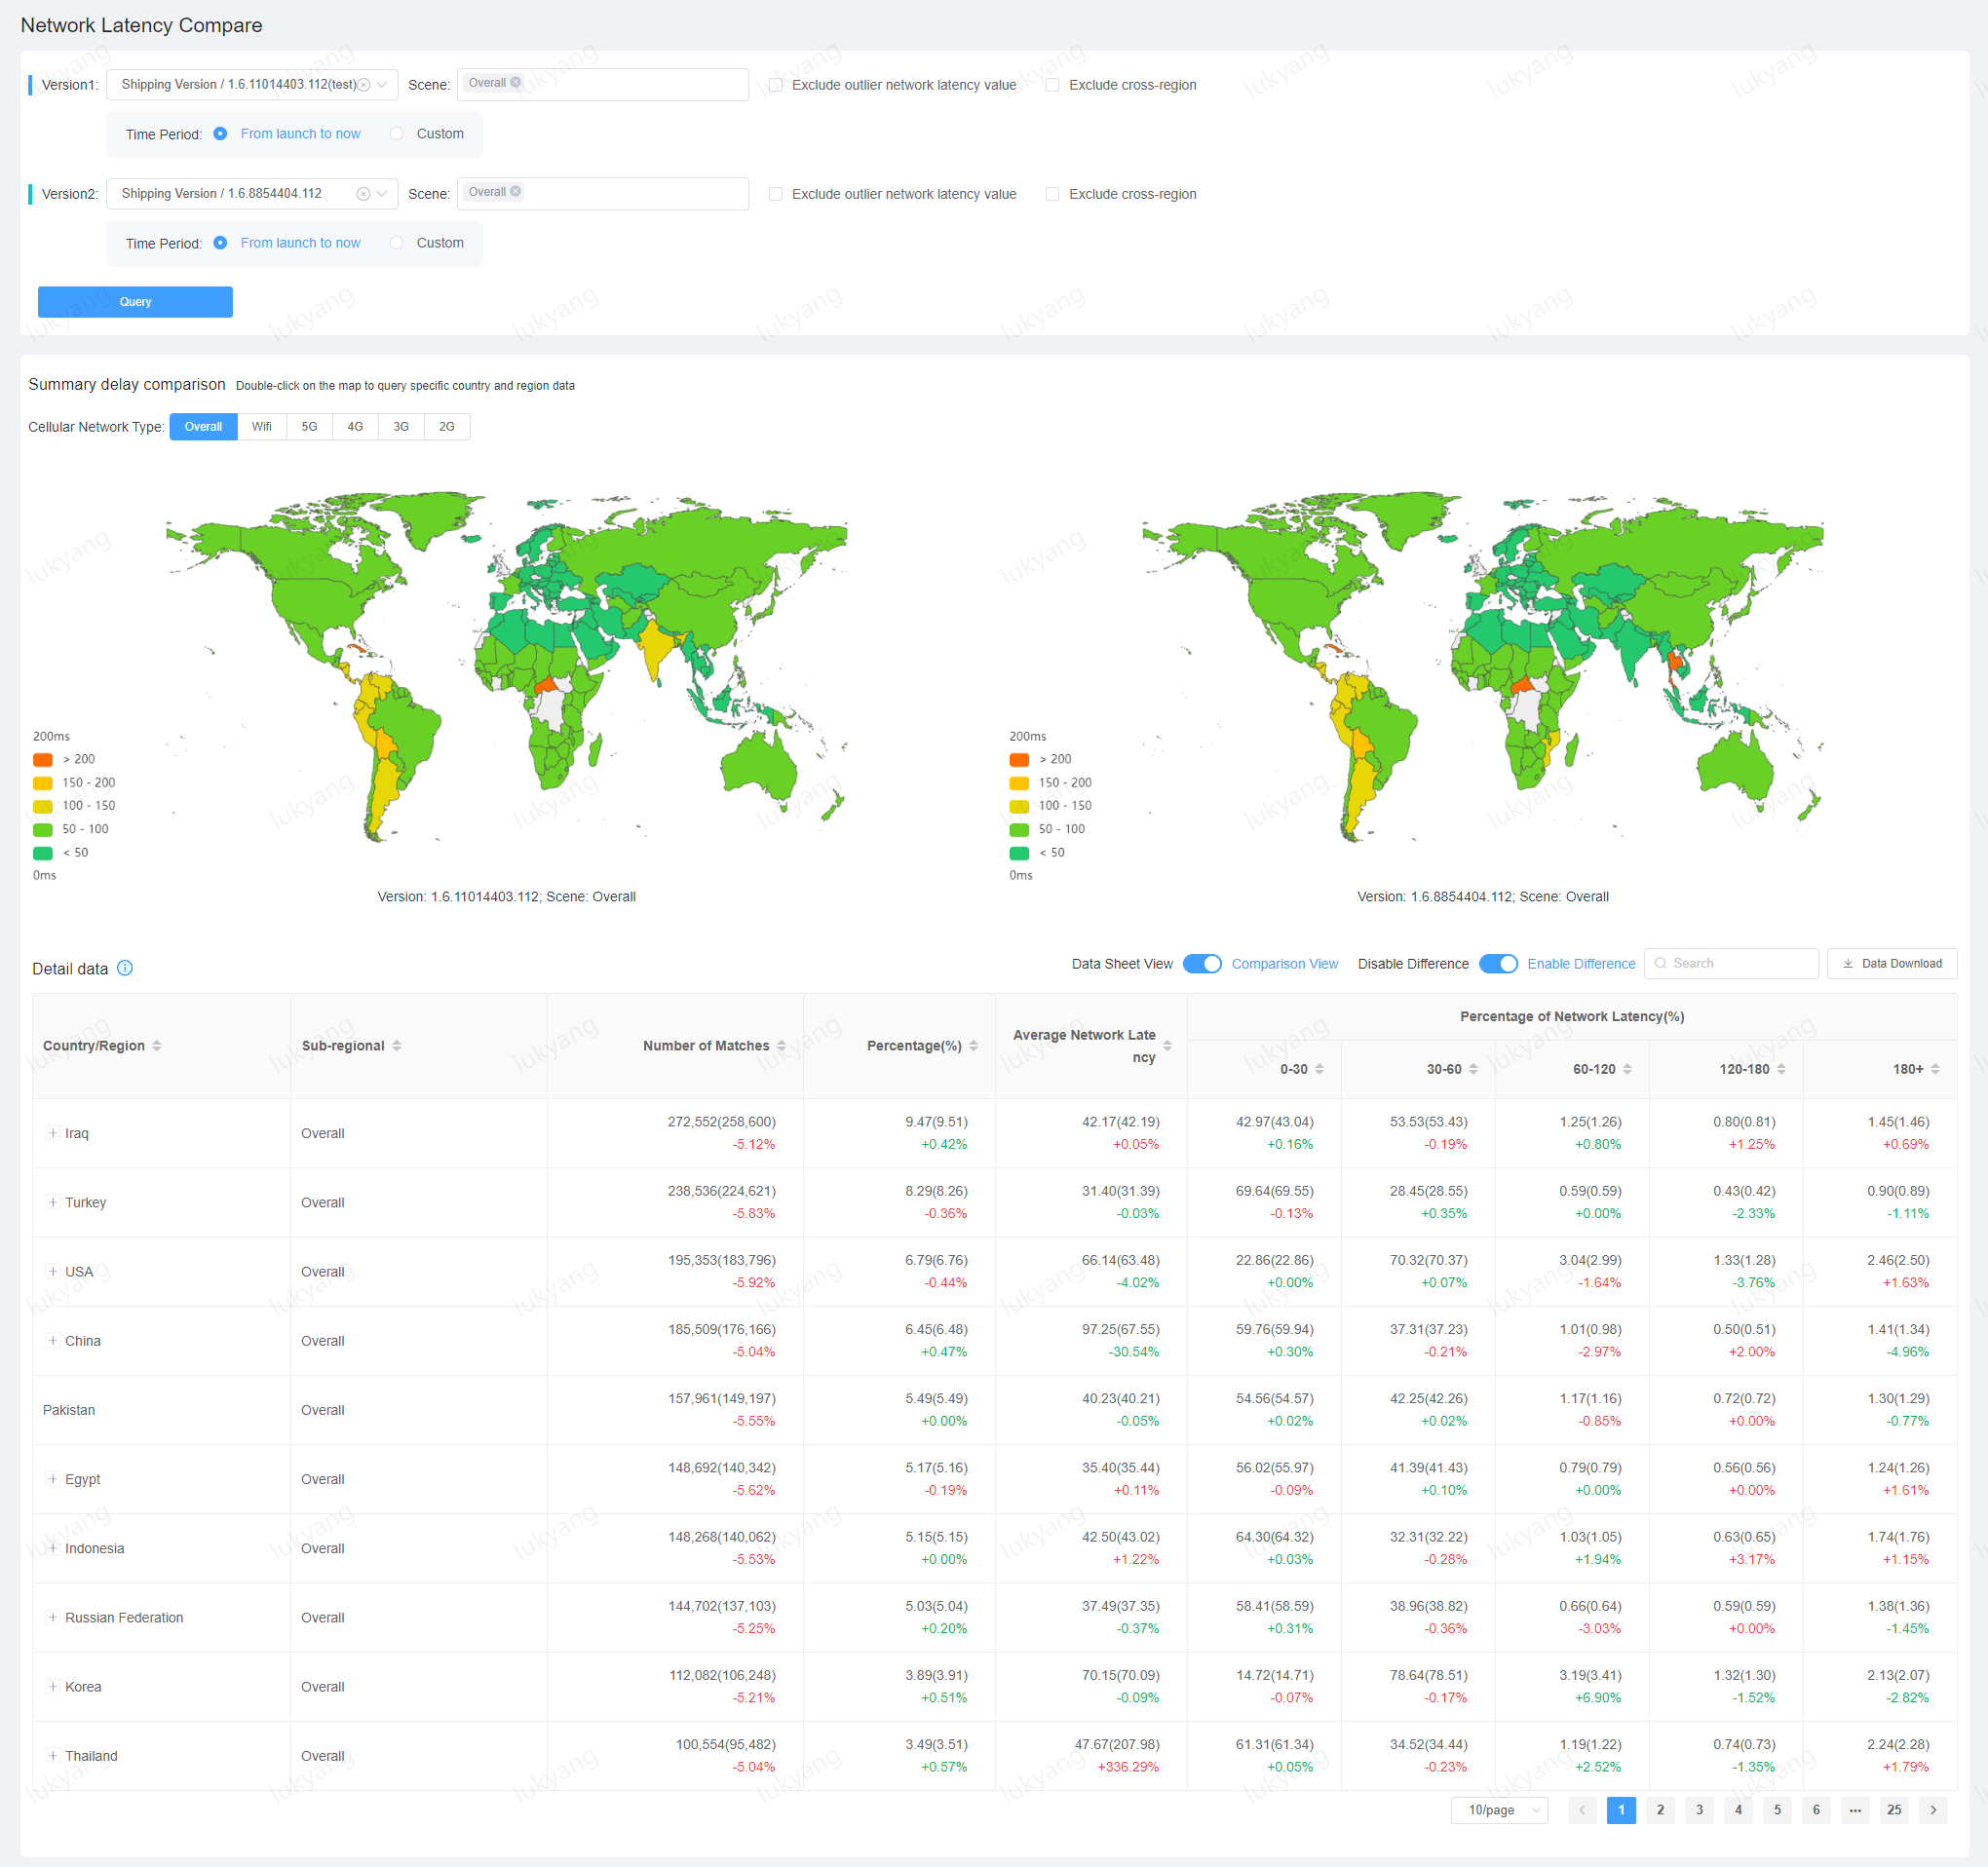
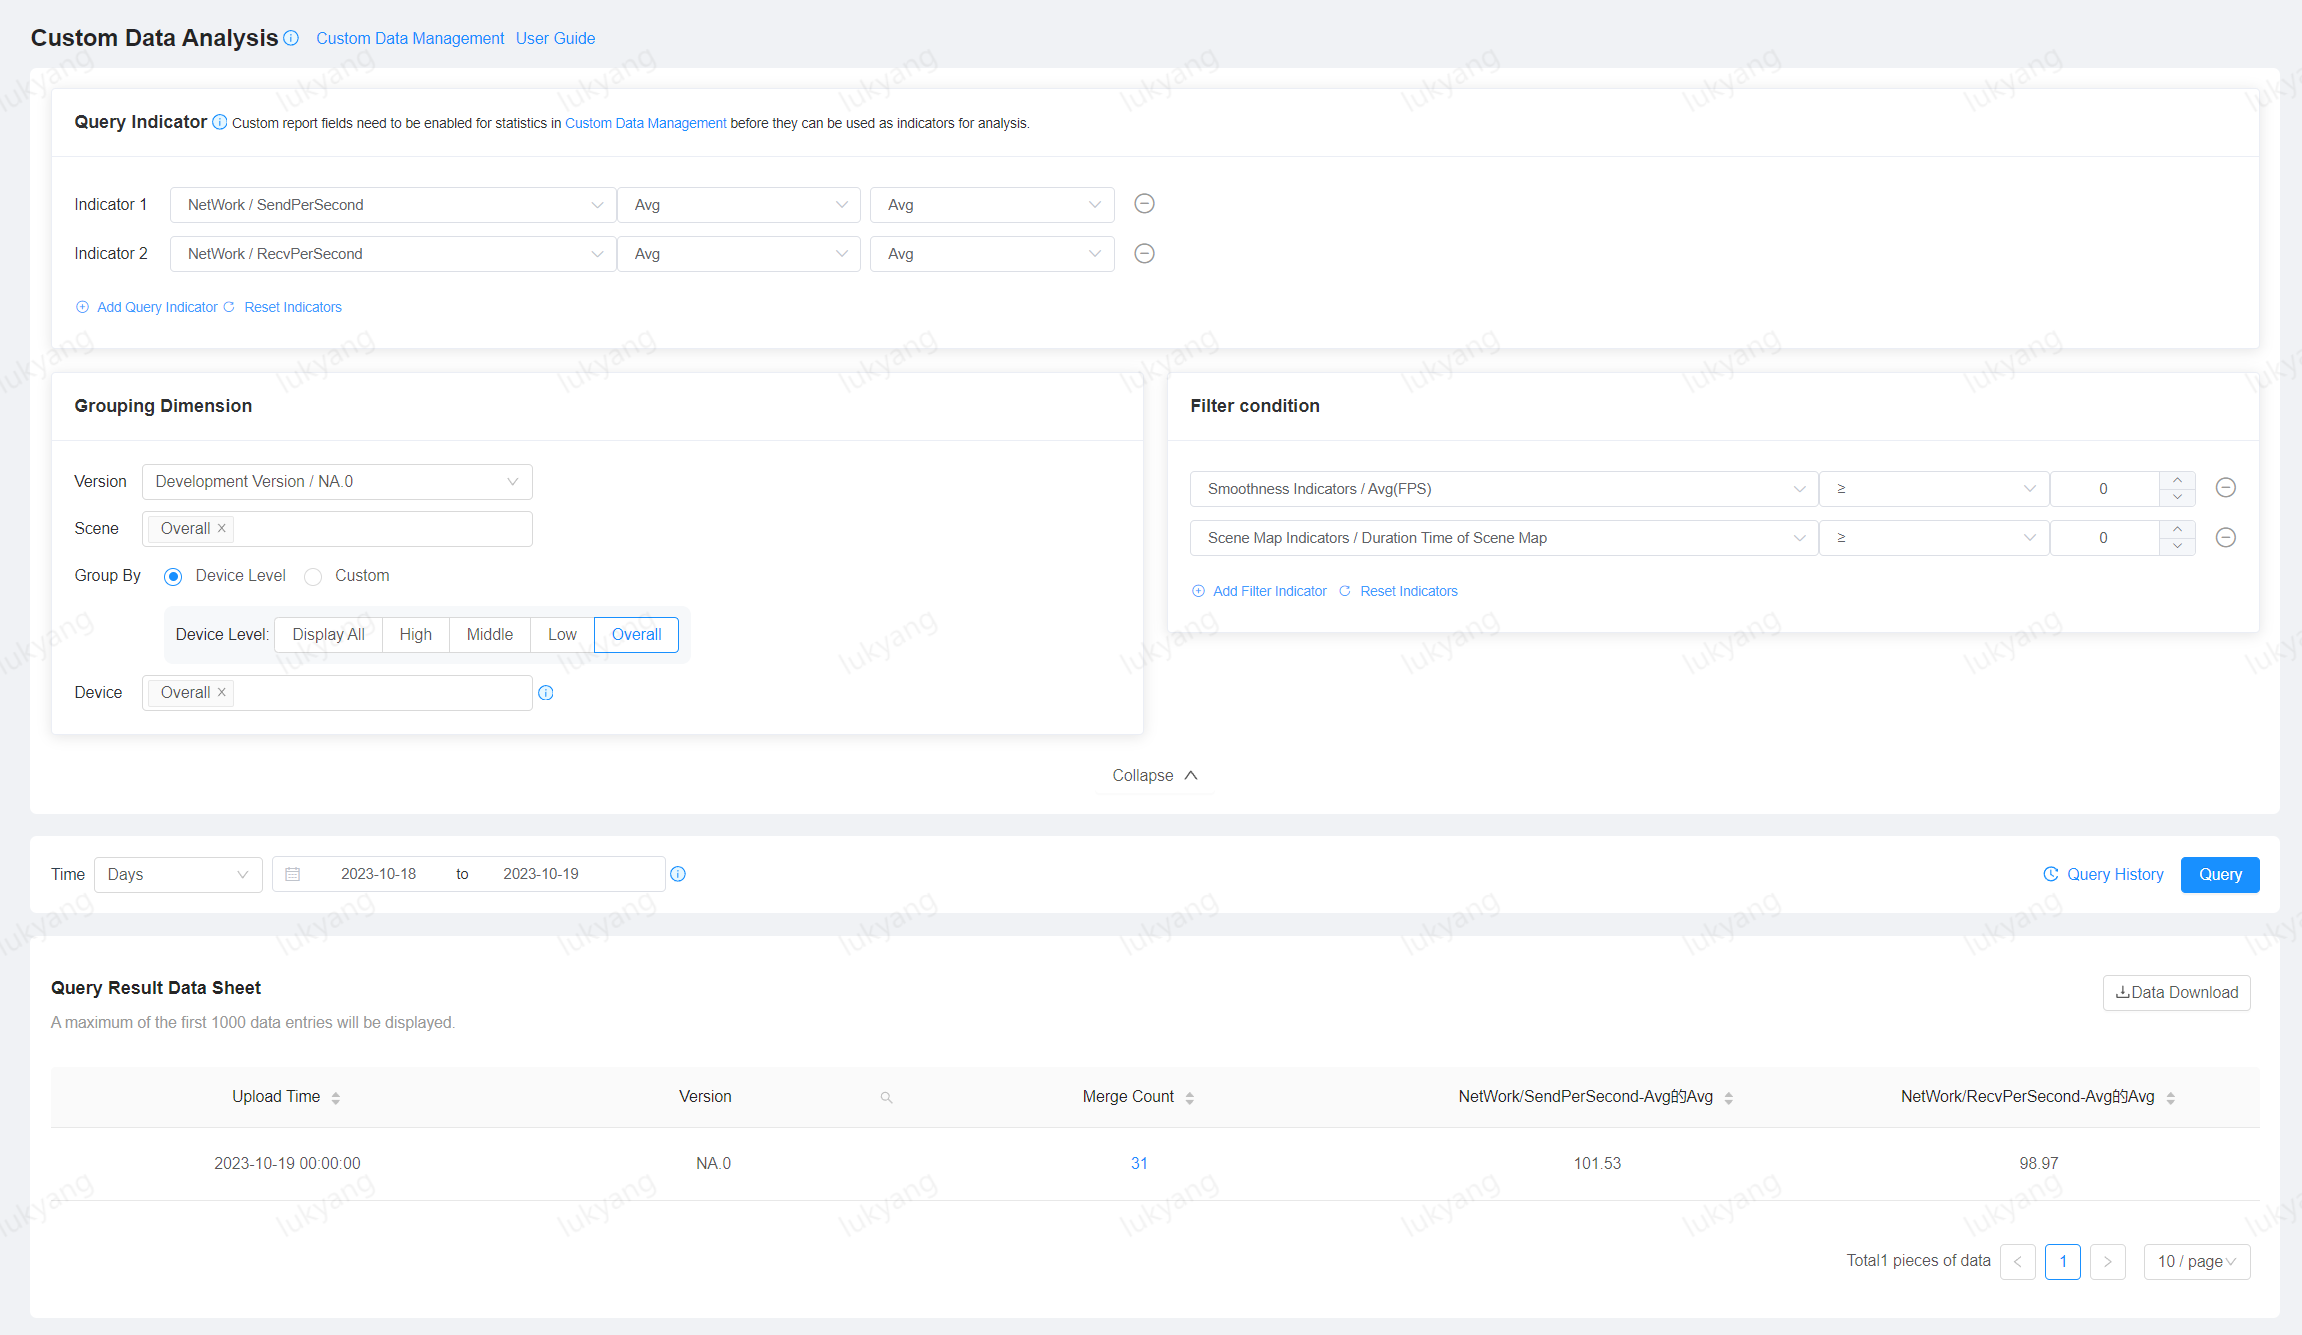
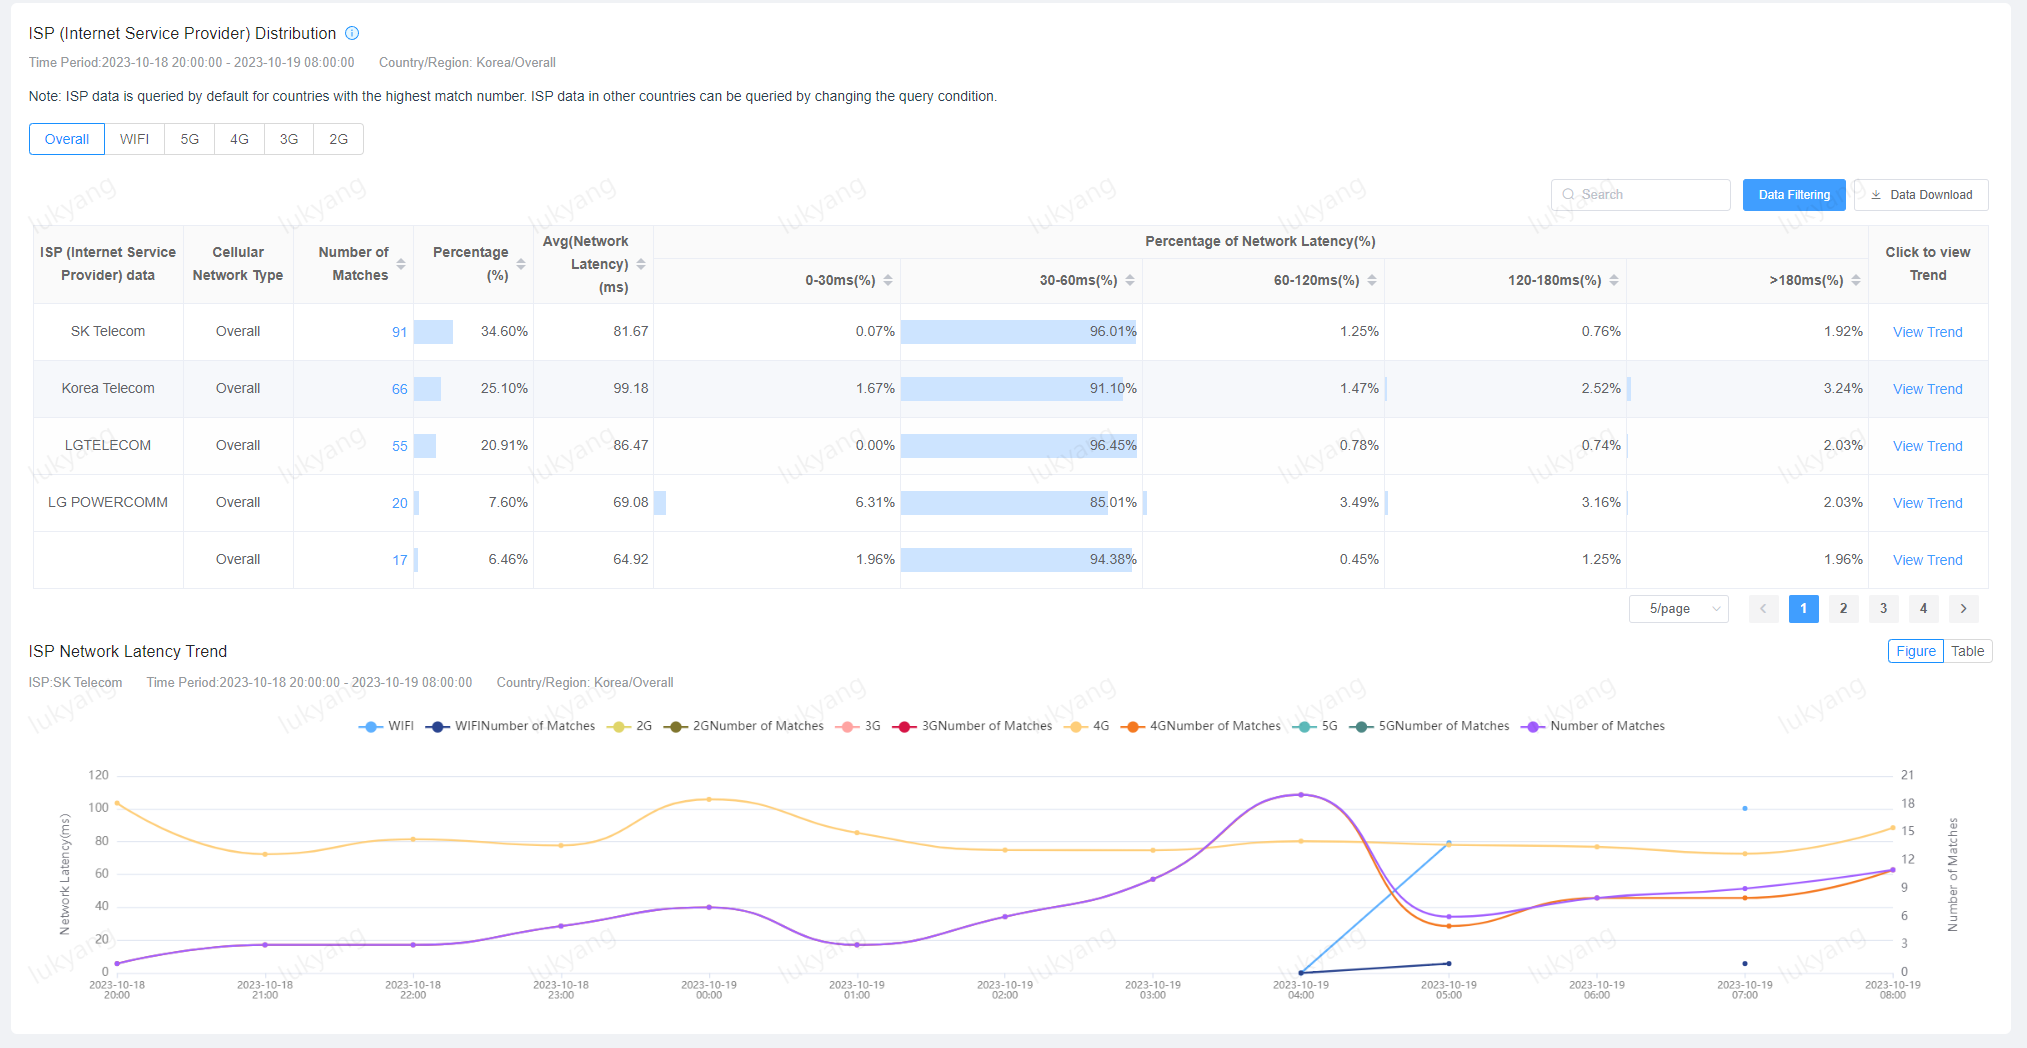
7. Key-value Analysis
In the Custom Data Management Page can enable customized data analysis for specific categories. In this example, we enable custom data analysis for "SendPerSecond" and "RecvPerSecond" under the "NetWork" type.  For the custom data reported after enabling analysis, you can view the analysis of the corresponding data on the Custom Analysis Page.